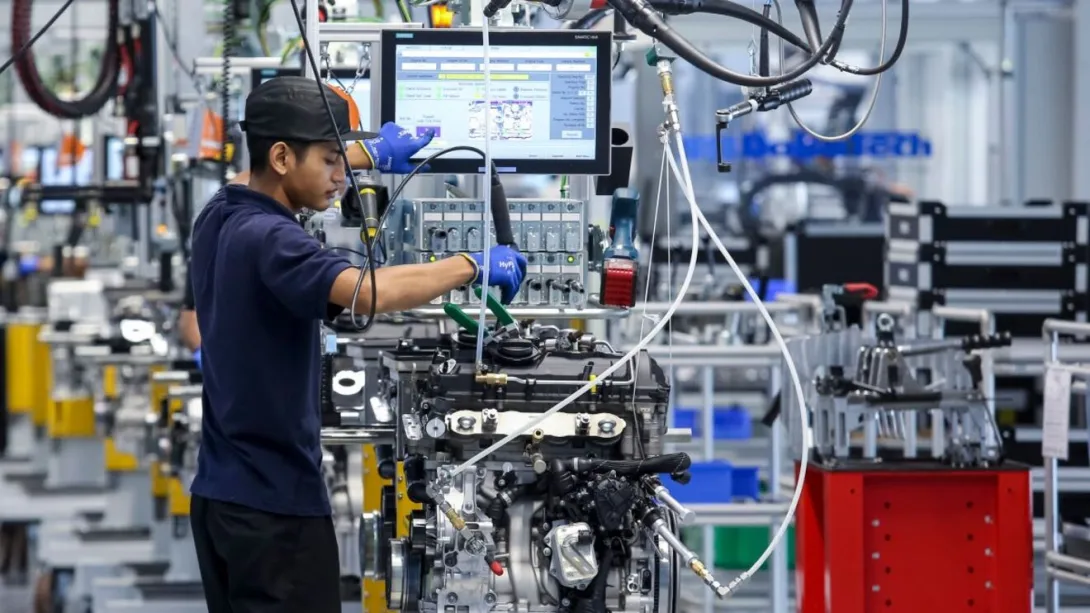
© Shuterstock/Abdul Razak Latif | Workers at an engine assembly plant in Kedah, Malaysia.
UNCTAD's statistics show how countries are building productive capacities – and why progress remains uneven.
In many of the world’s poorest economies, growth numbers can rise while people’s lives barely change. The missing link is not always investment or resources. It’s productive capacity.
Newly published data from UN Trade and Development (UNCTAD) offers a clearer picture of how productive capacities are evolving – and where the gaps remain most urgent.
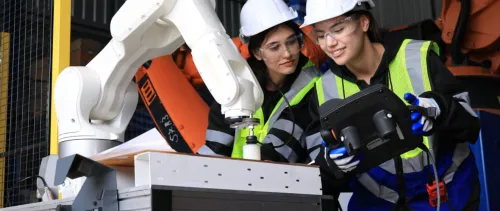
Productive capacities are the combination of resources, skills and links between economic actors and sectors that enable the production of goods and services. They are the foundation of long-term growth, job creation and poverty reduction.
In a world shaped by climate shocks, geopolitical tensions and economic uncertainty, resilience is more vital than ever. Countries that build strong productive capacities are best placed to adapt, perform and grow.
To better understand and measure these capacities, UNCTAD has developed tools to support countries in strengthening them.
Measuring what really drives economic transformation
At the heart of this work is the Productive Capacities Index (PCI), a tool designed to shift the focus from outputs like GDP to the underlying drivers of development.
The PCI measures how well countries can produce goods and services by assessing 43 indicators across eight key areas, including human capital, infrastructure, energy, institutions and the private sector.
The latest data from the index reveals how productive capacities vary across countries and regions, highlighting stark divides.
A world of uneven productive capacities
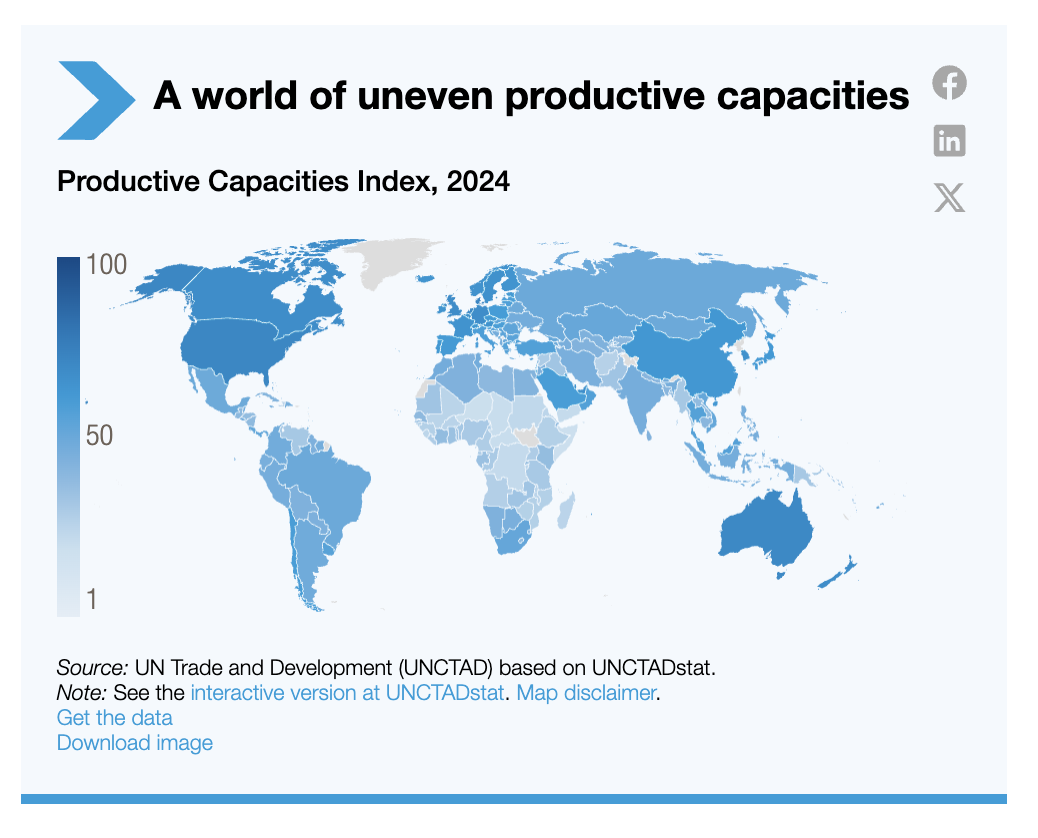
Developed economies score very high overall. Among developing regions, Asia and Latin America perform better than Africa.
At the lower end of the spectrum, several African economies register scores below 20, highlighting persistent structural constraints. Within the continent, South Africa, Tunisia and Morocco stand out as top performers, with an average score of 49.2 – a relatively strong result compared to other countries in the region.
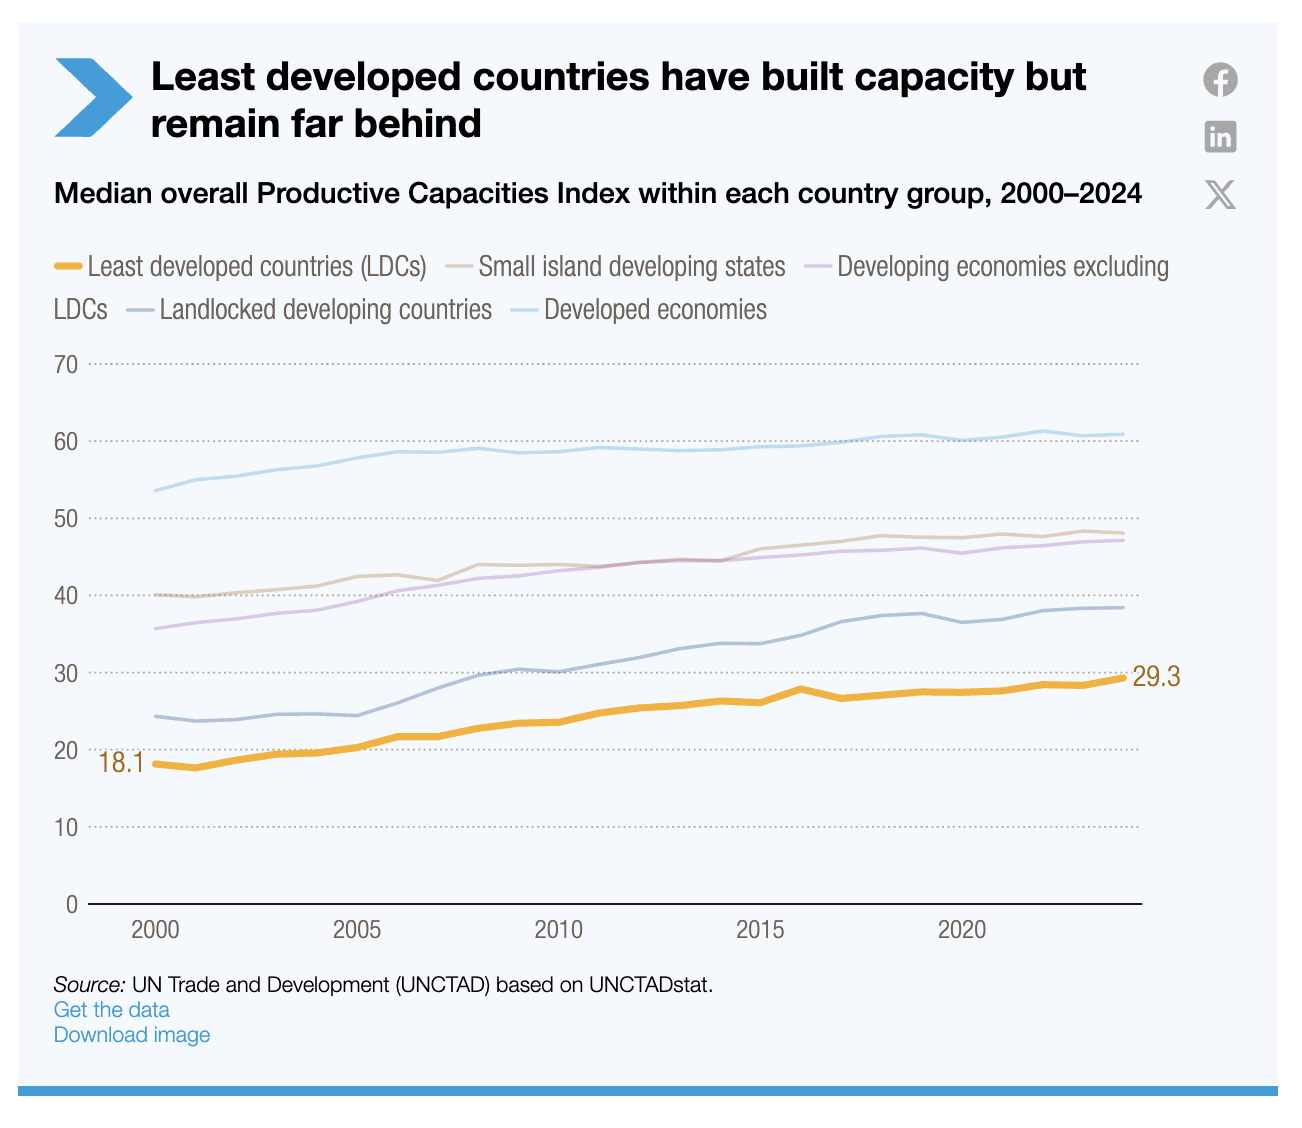
Developed economies remain far ahead in productive capacities, but progress has slowed since COVID-19.
Developing countries have made notable gains since 2000, yet the gap persists, with little sign of closing. LDCs have advanced steadily, though more slowly since 2016. Meanwhile, small island developing states, once above the developing-economy median, have lost momentum and are now aligned with other developing economies.
Between 2000 and 2024, growth in productive capacities among LDCs has been driven by strong gains in information and communication technology (ICT).
Technology drives gains in least developed countries
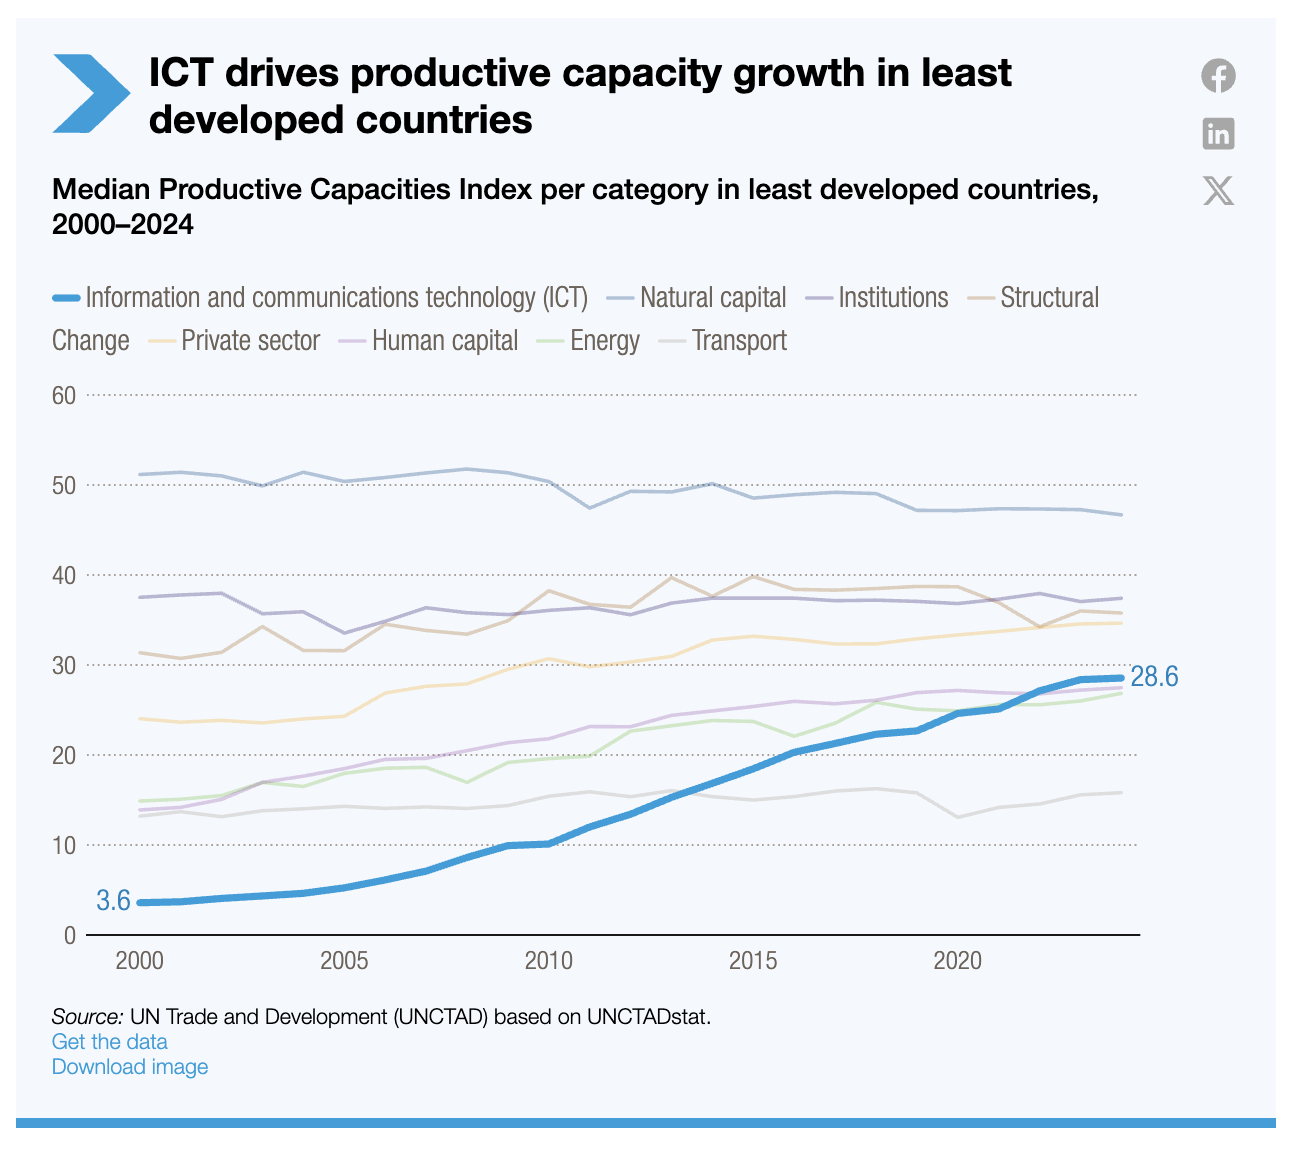
Natural capital remains the largest component of LDCs’ productive capacities, though it has slightly declined since 2000. Defined as a country’s stock of natural resources and environmental assets that support economic activity, it is both a key asset and a source of vulnerability due to risks associated with commodity dependence.
Productive capacities are the path to lasting development
A recent example shows how this framework translates into real investment.
In the Democratic Republic of the Congo – a country rich in natural resources but facing persistent poverty – the government has pledged new funding to expand productive capacities with UNCTAD’s support.
The evidence is clear, but action must accelerate. Governments and development partners should move beyond GDP and adopt multidimensional tools like the PCI for planning and evaluation.
The goal is clear: to move from exporting raw resources to building diversified, value-added industries.