
The new live version of the Handbook of Statistics provides timely, reliable data on global trade and development trends to help policymakers navigate an uncertain economic landscape.
In an uncertain economic landscape, timely and reliable data is essential for shaping policies that drive inclusive, sustainable growth.
The latest edition of UN Trade and Development’s (UNCTAD) annual Handbook of Statistics is a key resource for understanding global trade and development trends.
This year, UNCTAD introduced Data Insights, a live version of the handbook offering constantly updated data and analysis to track key indicators as they evolve.
Global trade: Goods and services took different paths

Trade in 2023 saw a sharp contrast between goods and services. While merchandise exports slumped, services surged, driven by a rebound in travel and increasing demand for digital services.
Key takeaways
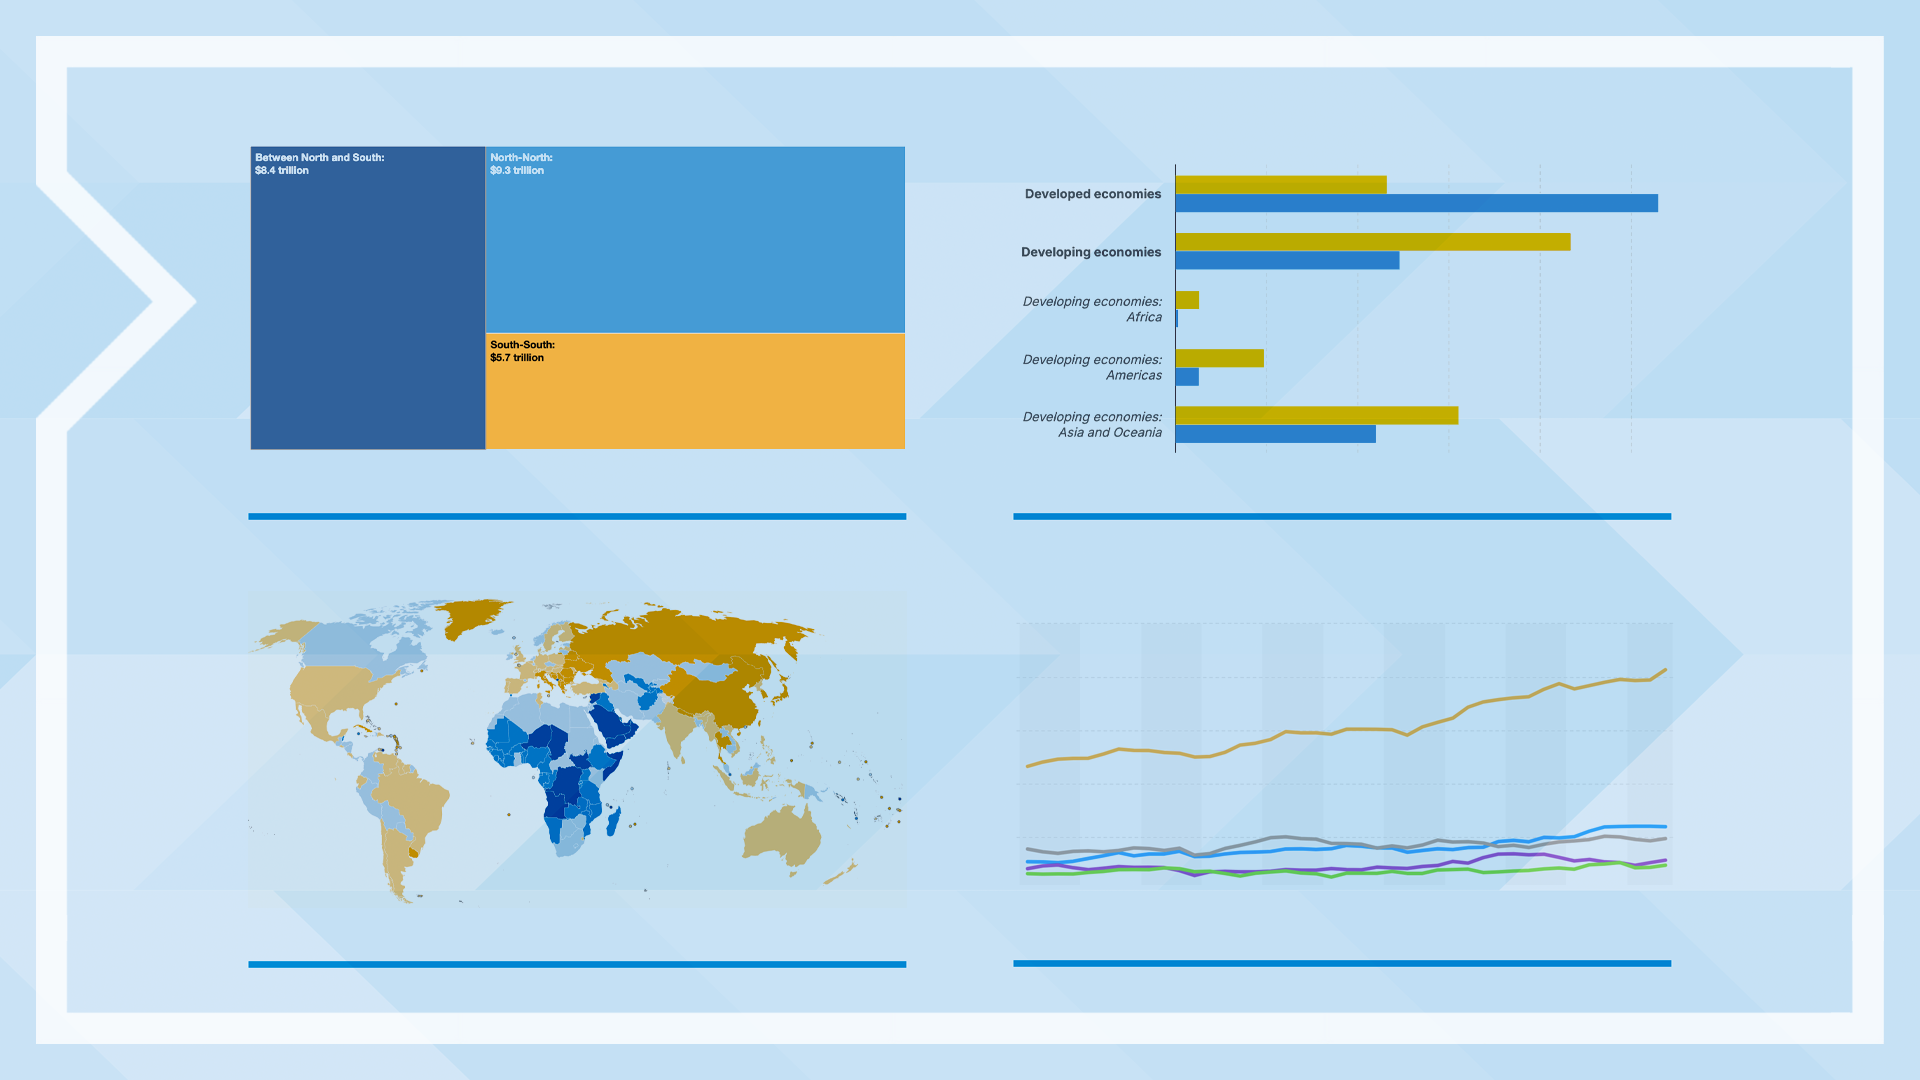
- Global merchandise exports fell 4.3% to $23.8 trillion, with a sharper decline in developing economies (-6.2%) than developed ones (-2.8%). Africa saw the steepest drop (-9.8%), importing nearly three times more manufactured goods than it exported.
- South-South trade in goods contracted by 7% to $5.7 trillion. Trade between developing countries was 24% of the global total, up from 15% in 2005.
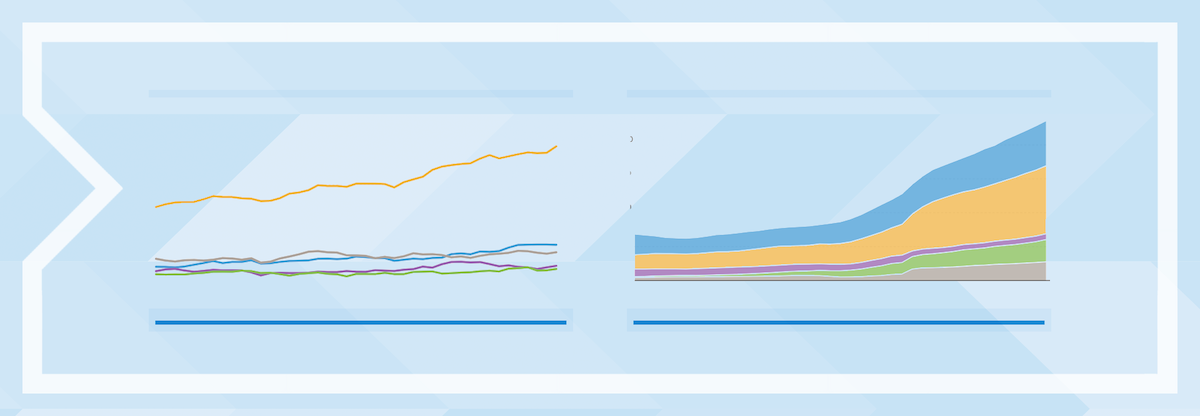
- Global services exports rose 8.3% to $7.9 trillion, driven by growth in travel (34%) and services that can be delivered digitally (over 8%), such as financial and business services. The United States remained the top services exporter, capturing 13% of the global market.
- Asian economies exported 56% of the Global South’s services, with China leading with $381 billion in exports.
Economic growth: Developing economies outpaced developed ones

As the global economy slowed in 2023, developing economies grew faster than developed ones but faced persistent challenges, including shrinking trade surpluses and declining foreign direct investment (FDI).
Key takeaways
- Global GDP growth slowed to 2.7%, down from 3.1% in 2022. Developing economies outpaced developed ones, growing at 4.1% compared to 1.7%.
- Large disparities in GDP per capita persisted. Most developed economies exceeded $30,000 per capita, while many African economies remained below $1,000. Most economies in developing Asia and the Americas surpassed $3,000.
- Global FDI fell 2% to $1.33 trillion. Developing economies saw a sharper 7% decline, but the least developed countries defied the trend, growing 17% to $31 billion.
- Commodity prices dropped nearly 24% after peaking in 2022, driven by a 32.1% decline in fuel prices.
MORE ECONOMIC DATA AND INSIGHTS
Population dynamics: Demographic shifts had economic implications
Population growth in 2023 brought both opportunities and challenges, as some regions benefitted from expanding working-age populations, while others struggled with aging demographics.
Key takeaways
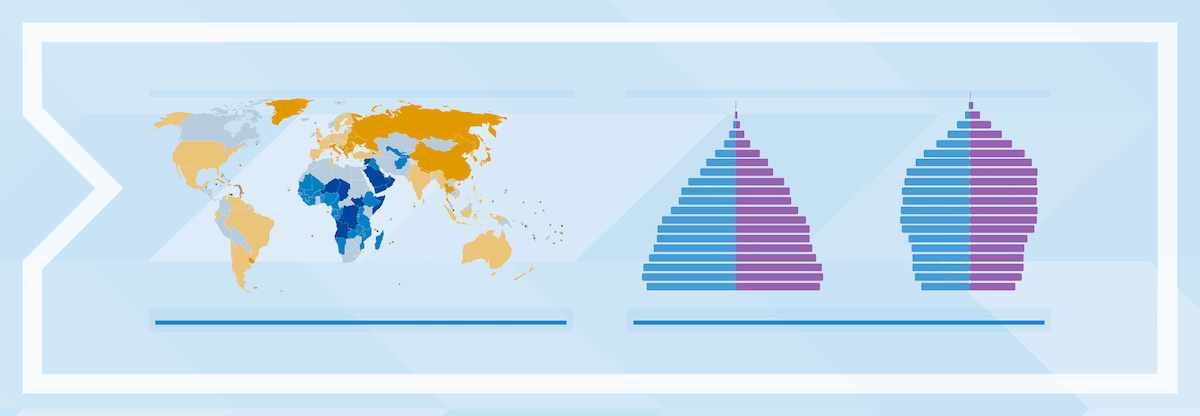
- Five out of six people (83%) lived in a developing economy, a share expected to reach 86% by 2050.
- Africa led global population growth at 2.3%, increasing its global share to 18.7%. Asia remained the most populous region (59.5% of the total), while Europe’s share declined to 9.5%.
- Urbanization accelerated worldwide, with 57.3% of people living in cities. Urbanization rates are generally higher in developed (79.9%) than developing (52.8%) economies. In LDCs, only 36.4% of people live in urban areas.
- Globally, for every 100 working-age people there were 54 dependents. Africa had the highest child dependency ratio (69%), while high-income economies had the lowest (45%), driven by rising old-age dependency.
MORE POPULATION DATA AND INSIGHTS
Maritime transport: Trade volumes dipped, but the fleet expanded
Maritime transport, which moves over 80% of global trade, saw a slight contraction in 2023, while the global fleet expanded and freight rates stabilized.
Key takeaways
- Developing economies drove global maritime trade volumes, loading 55% and unloading 70% of seaborne goods in 2021. Developing Asia led the way (42% loaded, 64% unloaded), cementing its role as a supply chain hub.
- The Global South’s maritime trade deficit reached 648 million tons in 2021, as developing economies discharged more cargo than they loaded – including bulk and containerized goods.
- Containerized trade contracted by 1.5%, reflecting weaker demand for manufactured goods.
- The global fleet grew by 3%, with developing economies owning 41%. Investments in bulk carriers and tankers highlighted ongoing demand for raw materials and energy products.