
The numbers that are shared in the article below reflect the numbers in August 2021. The analysis of the economic and aviation indicators we share here reflect the continuing impact of COVID-19 on this industry.
The air transport industry is not only a vital engine of global socio-economic growth, but it is also of vital importance as a catalyst for economic development. Not only does the industry create direct and indirect employment and support tourism and local businesses, but it also stimulates foreign investment and international trade.
Informed decision-making is the foundation upon which successful businesses are built. In a fast-growing industry like aviation, planners and investors require the most comprehensive, up-to-date, and reliable data. ICAO’s aviation data/statistics programme provides accurate, reliable and consistent aviation data so that States, international organizations, the aviation industry, tourism and other stakeholders can:
- make better projections;
- control costs and risks;
- improve business valuations; and
- benchmark performance.
The UN recognized ICAO as the central agency responsible for the collection, analysis, publication, standardization, improvement and dissemination of statistics pertaining to civil aviation. Because of its status as a UN specialized agency, ICAO remains independent from outside influences and is committed to consistently offering comprehensive and objective data. Every month ICAO produces this Air Transport Monitor, a monthly snapshot and analysis of the economic and aviation indicators.
ECONOMIC DEVELOPMENT – October 2021
World Results and Analyses for August 2021
Total Scheduled Services (Domestic and International)
Passenger traffic
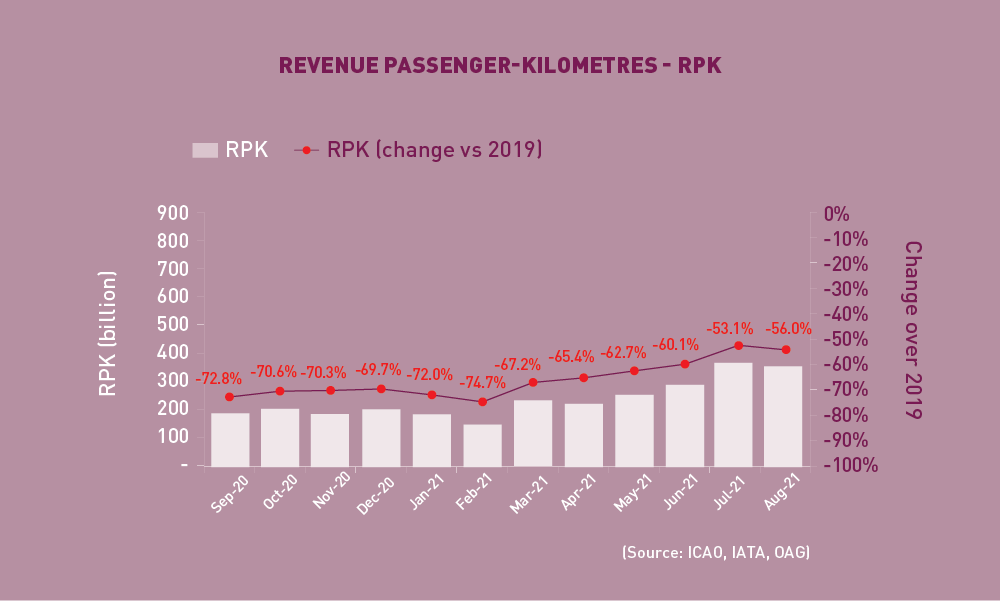 Revenue Passenger-Kilometres – RPK
World passenger traffic fell by -56.0% in August 2021 (compared to 2019), -2.9 percentage points down from the decline in the previous month. This deterioration was mainly attributed to the weakening in domestic markets, and particularly Chinese domestic travel, which plunged dramatically due to the new outbreaks and the more stringent travel restrictions. Some other major domestic markets also worsened. International travel, however, continued to improve in most of the regions, except for Asia/Pacific, where restrictions remain stricter than others.
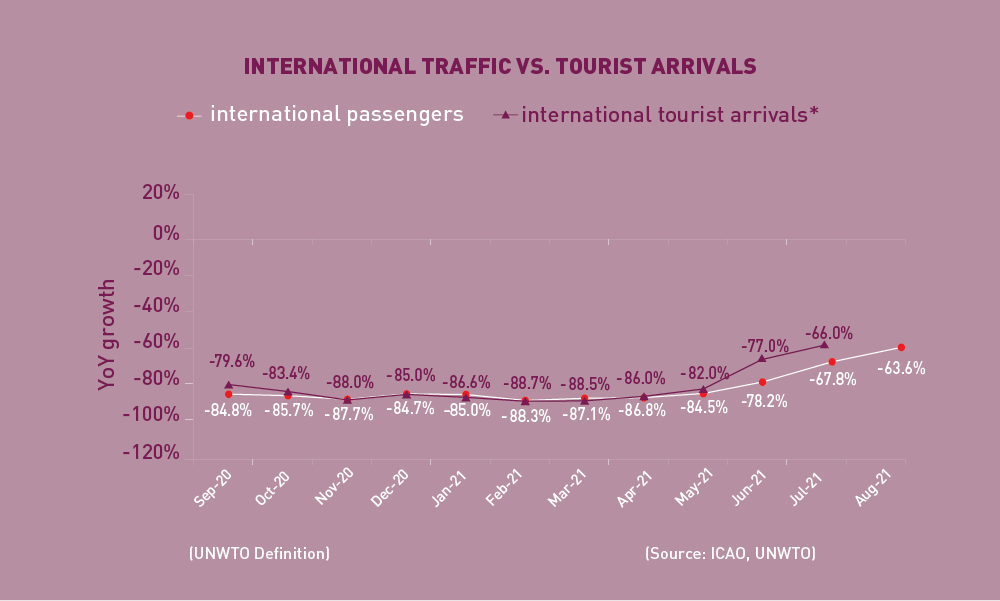 International Traffic vs. Tourist Arrivals
International passenger numbers fell by -63.6% in August 2021 (compared to 2019), +4.2 percentage points up from the decline in the previous month. Easing travel restrictions and progress with vaccinations has supported the continued improvements in international travel. The significant rebound was recorded by intra-European travel.
The international tourist arrivals also picked up and followed a similar trend as international passenger traffic.
Capacity
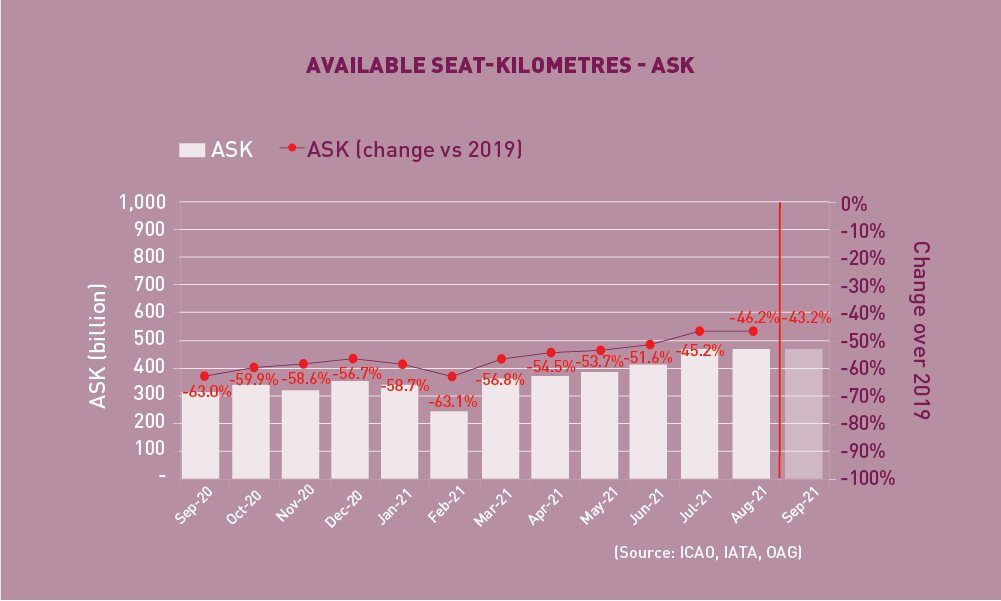 Available Seat-Kilometres – ASK
Capacity worldwide fell by -46.2% in August 2021 (compared to 2019), down -1.0 percentage points from the decline in the previous month (-45.2%). With signs of travel rebound towards the end of August, capacity is expected to increase moderately in September 2021 to -43.2% down from the 2019 levels.
Load Factor
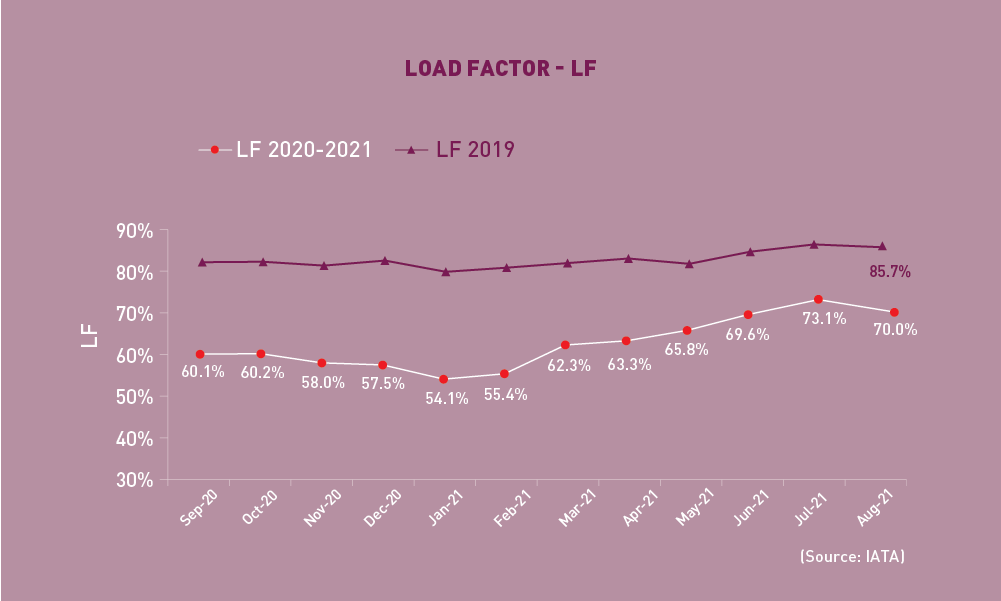 The passenger load factor reached 70.0% in August 2021, -3.1 percentage points lower than the previous month. Worsened domestic travel also resulted in a lower domestic load factor. As the recovery of capacity was faster than travel demand recovery, the August LF remained significantly below 2019 levels at -15.7 percentage points lower.
Freight Traffic
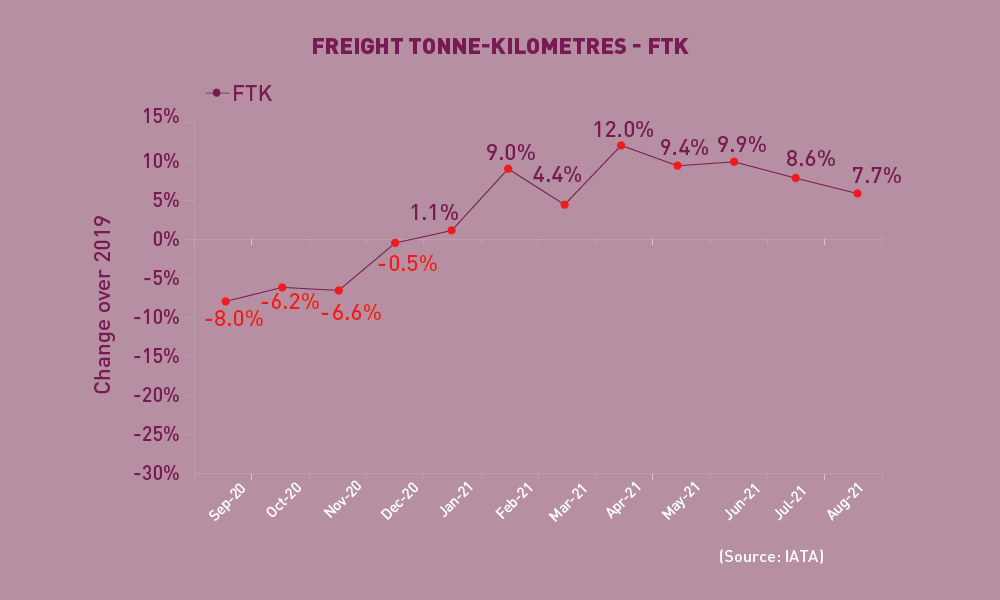 Freight Tonne-Kilometres – FTK
World freight traffic reported a growth of +7.7% in August 2021 (compared to 2019), -0.9 percentage points lower than the growth in the previous month. The softening in air cargo growth reflected the slower expansion in export and manufacturing production. Nevertheless, the global demand for goods is expected to be supportive for air cargo growth in the coming months. Africa continued to outperform other regions, surpassing the 2019 levels at over +30%, albeit with the smallest share of world cargo traffic. North America and Middle East also rose double-digitally, while growth for Europe and Asia/Pacific airlines remained moderate. Latin America/Caribbean, the region with the second smallest share of world air cargo traffic, continued to be the only region posting contraction from 2019 levels.
Top 15 Airports (Ranked by aircraft departures, passengers, and volume of freight)
Note: Figures include total scheduled and non-scheduled services
July 2021: -11.9%, -28.0%, and +12.4% (vs. 2019) in terms of aircraft departures, passengers and freight for the Top 15
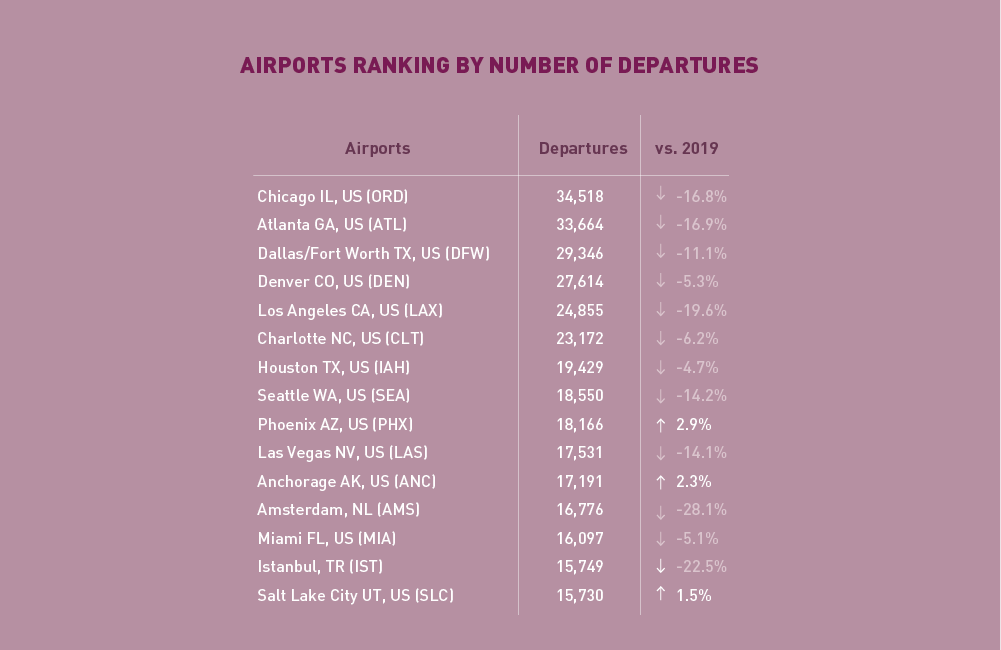 In terms of aircraft departures, the Top 15 airports reported a combined fall of -11.9%, compared to 2019. The Top 15 list remained dominated by US airports. Three airports, Phoenix, Anchorage and Salt Lake city, posted increases compared to 2019, albeit at a modest rate. Chicago remained 1st with a decline of -16.8%. Amsterdam and Istanbul also ranked within the Top 15.
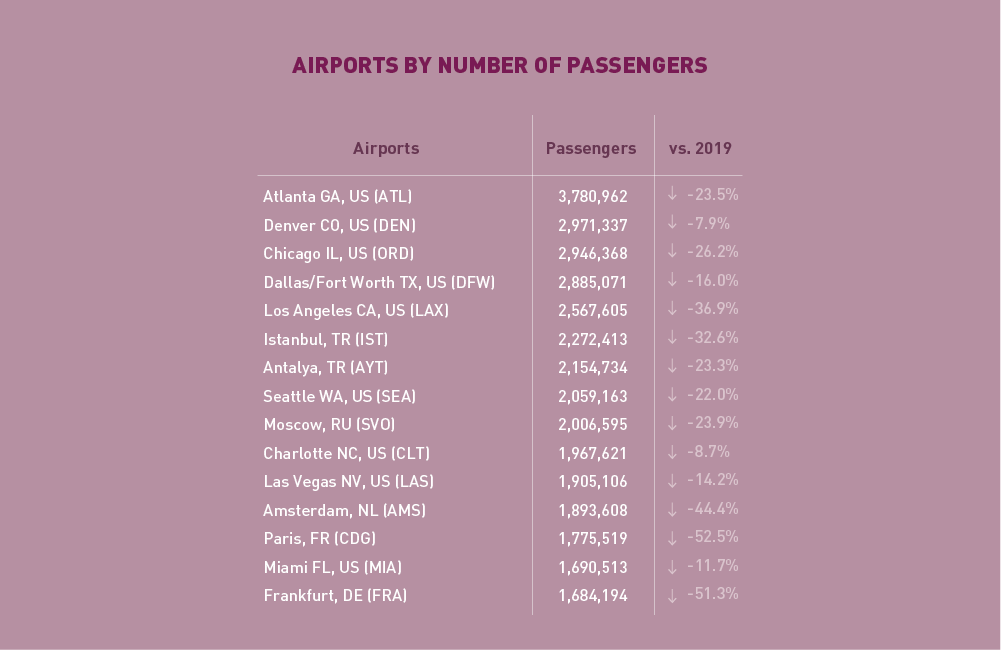 In terms of passengers, the Top 15 airports posted a total fall of -28.0%, compared to 2019. Unlike the previous months, the list is dominated by US and European airports. For the first time, both Istanbul and Antalya in Turkey ranked within Top 15. Amsterdam, Paris and Frankfurt, also re-appeared in Top 15 after over a year. Atlanta remained at 1st with a decline of -23.5%.
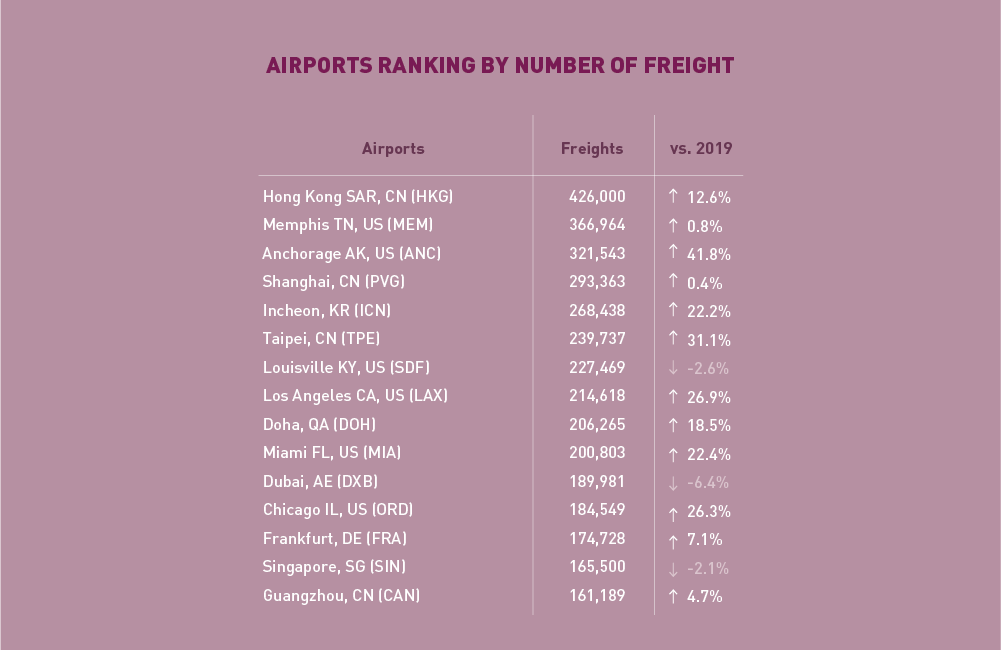
In terms of freight, the Top 15 airports reported an increase of +12.4%, compared to 2019. Hong Kong retained the 1st position with a solid growth of +12.6%. Several airports grew double-digitally, with Anchorage and Taipei recording the strongest increase by +41.8% and +31.1%, respectively. Dubai continued to post the largest contraction at -6.4%.
Top 15 Airline Groups (Ranked by RPK)
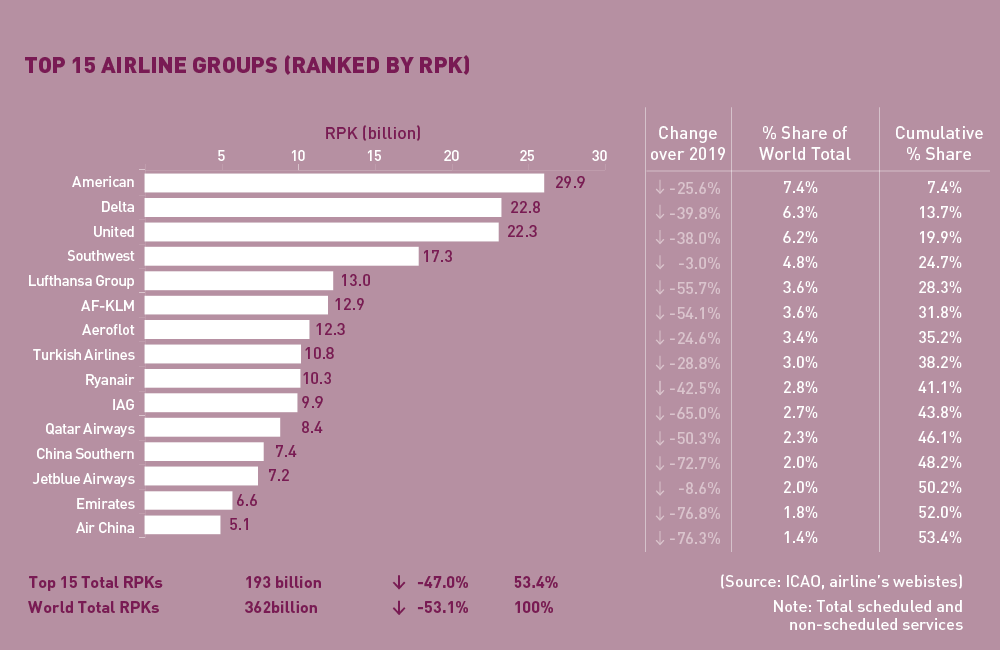
August 2021: –47.0% (vs. 2019) in terms of RPK for the Top 15
In terms of RPK, the Top 15 airline groups accounted for 53.4% of the world’s total RPK in August 2021 and declined by –47.0% compared to 2019. This decline was 6.1 percentage points smaller than the fall in world’s average RPK.
Two major factors affected significantly the August rankings. On one side, the Chinese domestic travel fell drastically impacted by the renewed outbreaks; on the other side, international travel in Europe picked up rapidly.
US airlines retained the Top 4 positions wit American ranked 1st followed by Delta, United and Southwest. Jetblue Airways also ranked in the Top 15 supported by solid domestic demand. Among all Top 15 airlines, Southwest posted the smallest decline compared to 2019 levels.
Chinese domestic travel demand worsened again with far worse deterioration than the previous ones, and all Chinese airlines experienced a drastic fall in traffic. As a result, only China Southern and Air China ranked within Top15, at merely 12th and 15th.
Supported by the pick up of intra-European travel, airlines in Europe moved up their rankings after the US airlines from 5th to 10th. Lufthansa and AF-KLM improved 4 and 2 positions to 5th and 6th, respectively.
Qatar Airways and Emirates ranked 11th and 14th, with the latter recording the largest contraction from 2019 levels.
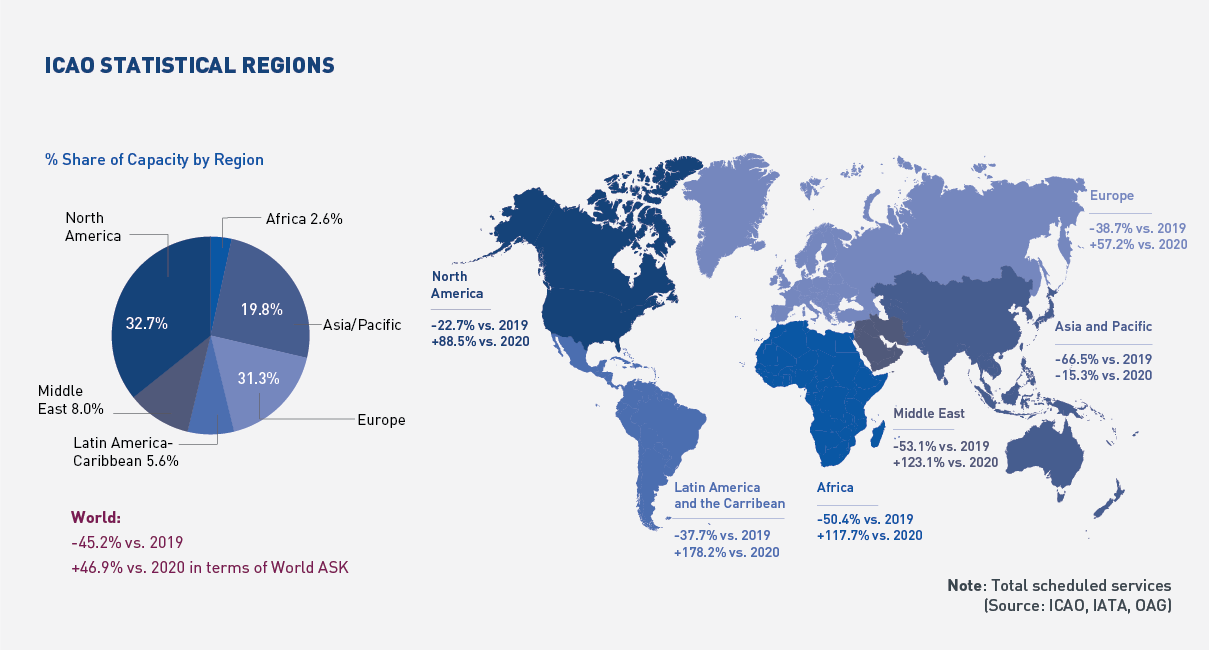
Worldwide capacity contracted by -46.2% in August 2021, compared to 2019. This indicated a slight deterioration from July, due to the capacity cut in Asia/Pacific, mainly in the Chinese domestic market. All other regions posted a smaller fall in capacity, with the strongest improvements in Europe the Middle East, mostly owing to the expansion in international capacity.
Acronyms: ACI: Airports Council International; ASK: Available Seat-Kilometres; IATA: International Air Transport Association; FTK: Freight Tonne-Kilometres; LF: Passenger Load Factor; OAG: Official Airline Guide; RPK: Revenue Passenger-Kilometres; UNWTO: World Tourism Organization; YoY: Year-on-year; YTD: Year-to-date.