Essential services shape how we live, work and adapt to change. Whether it’s digital platforms, health care, infrastructure, or a safe environment, these fundamentals are the foundation of resilient societies. As economies face challenges like inequality, climate change, and technological shifts, delivering inclusive and reliable services is crucial for sustainable progress.
The latest World Bank Group (WBG) Scorecard presents a clear but uneven picture of performance. Access to digital public services, internet access, health care, and water and sanitation is growing—however, progress remains uneven: some economies are making significant progress, while others are struggling to reach large segments of their populations, leaving gaps that affect daily life and future opportunities. The sections that follow highlight several of the refreshed Client Context and Vision Indicators of the WBG Scorecard and the insights they provide.
1. Digital and Connectivity
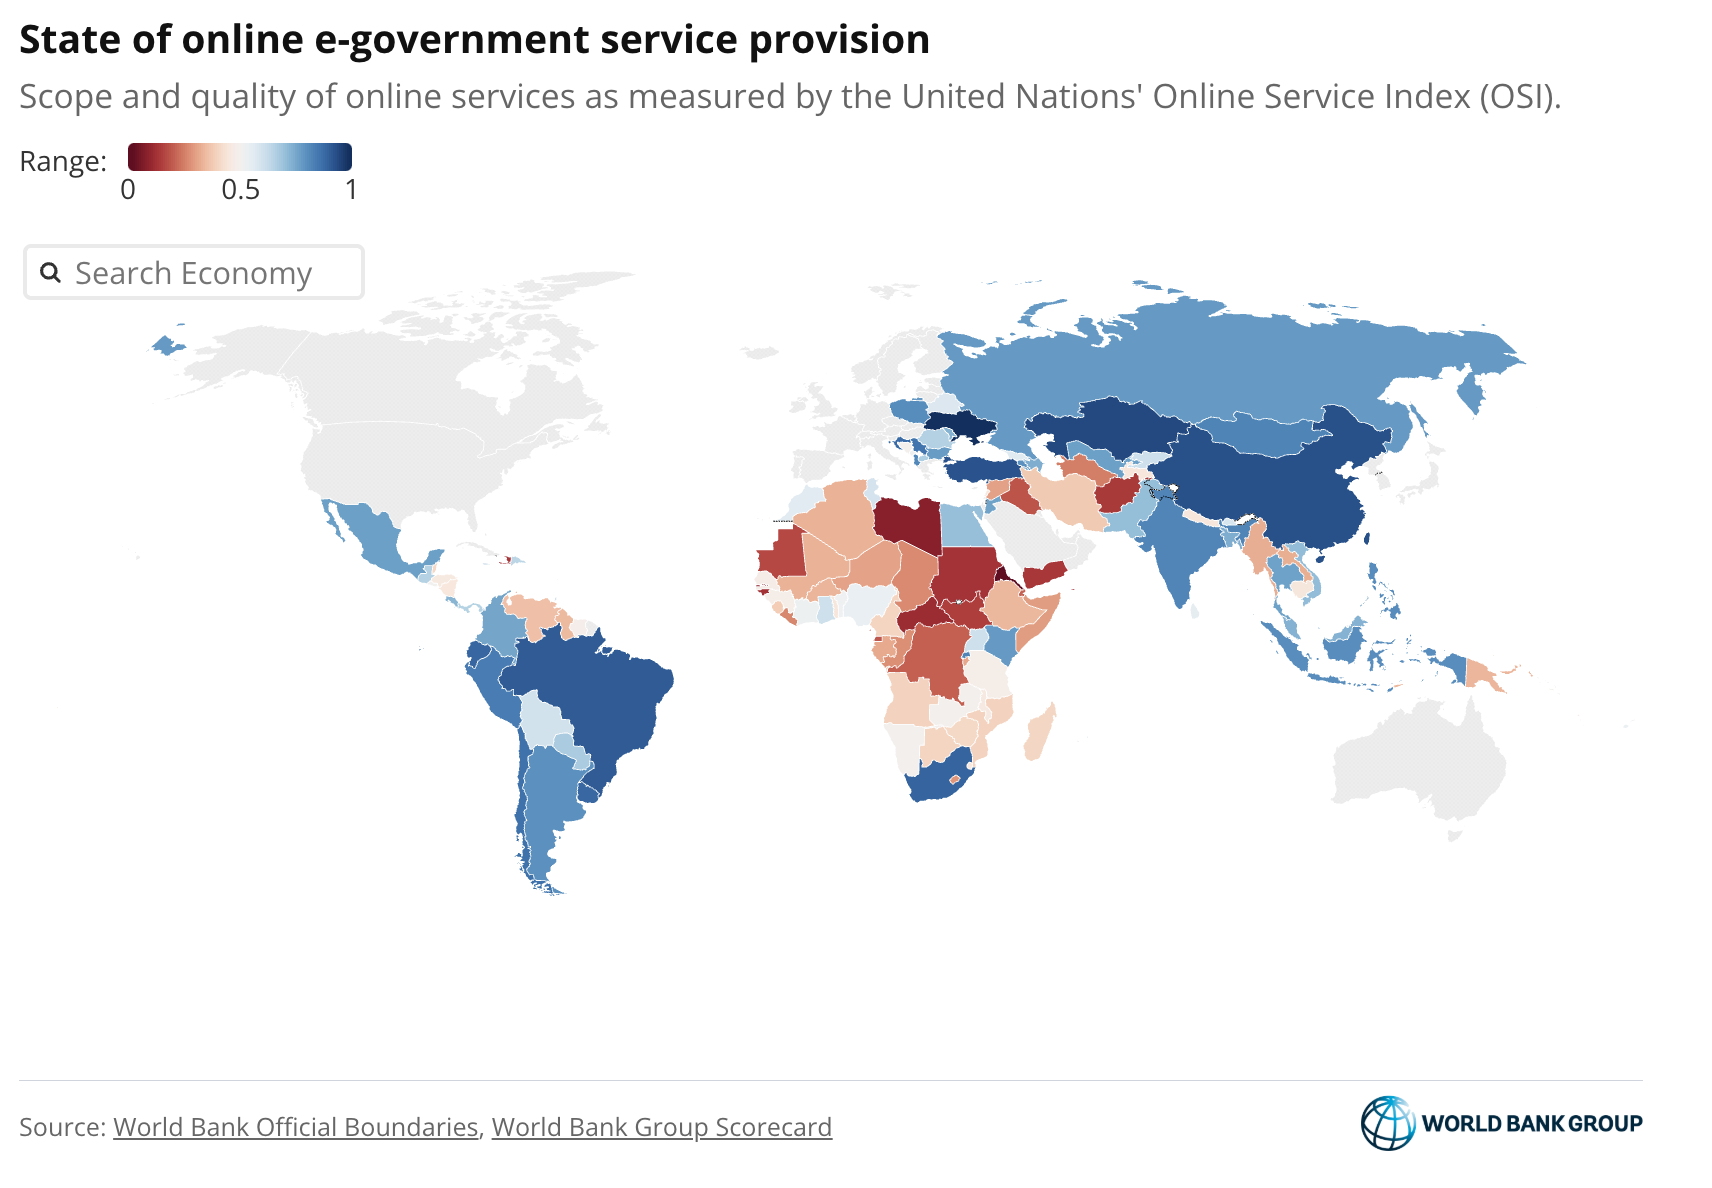
State of online e-government service provision
As governments increasingly shift public services online, the state of e-government service provision (score) offers a useful lens on how accessible, functional, and citizen-oriented digital public services have become. The score draws on the United Nations’ Online Service Index, capturing countries’ performance across key dimensions including service provision, institutional framework, technological infrastructure, digital content, and e-participation. The latest update (2024 edition) suggests uneven progress across countries: scores range from 0.36 in Africa Western and Central to 0.88 in North America, with a median of about 0.48 across 144 economies. Overall, the results point to substantial gaps in digital government readiness, indicating that while some countries have built strong online service ecosystems, many others still lag in delivering inclusive and effective digital services.
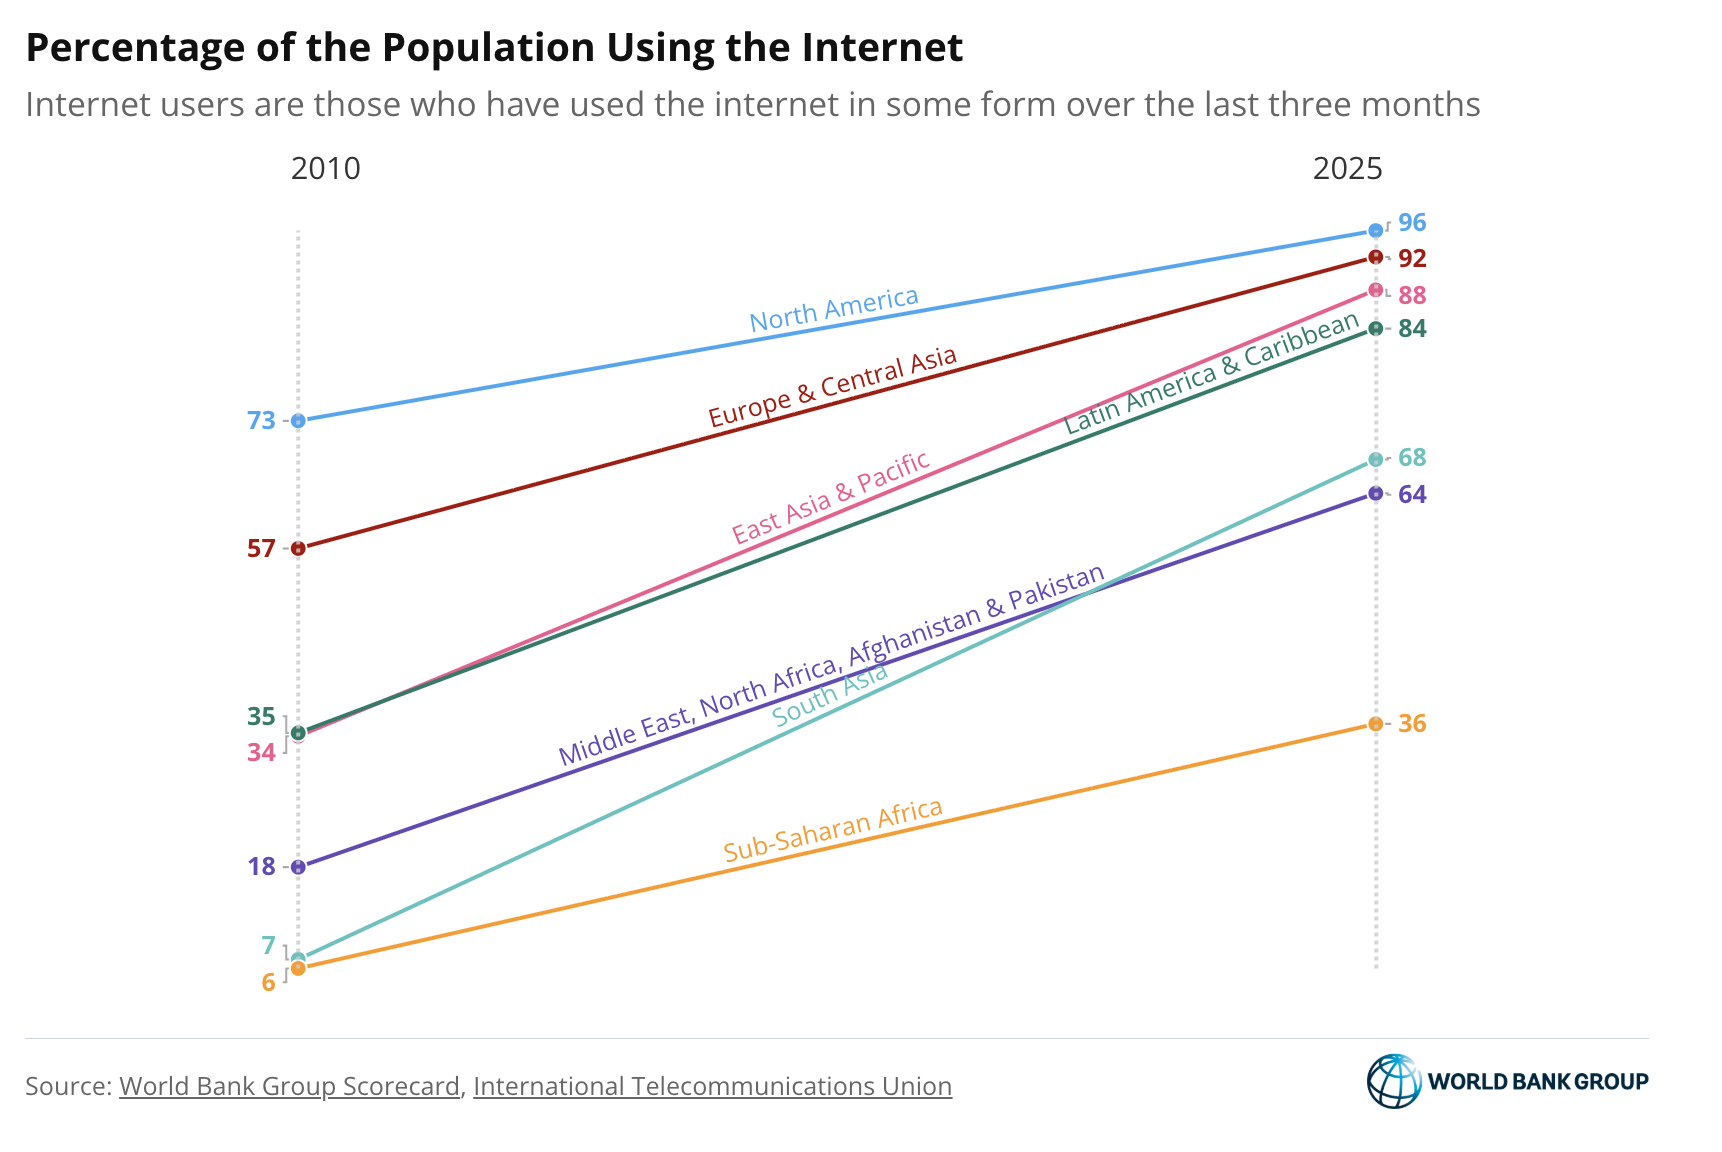
Percentage of population using the Internet
Global connectivity, measured by the share of the population using the internet, has massively improved over the last 15 years. North America and Europe & Central Asia remain the most connected regions, where about 9 in 10 people use the internet. The most pronounced transformations was observed in South Asia, where access rose sharply from just 7 percent to 68 percent of the total population, and in the East Asia & Pacific region, where it grew from 34 percent to 88 percent. Despite this global surge, a digital divide persists. Though access levels have increased nearly sixfold in Sub-Saharan Africa since 2010, it remains the least connected region, where less than 4 in 10 people currently use the internet.
2. Human Services
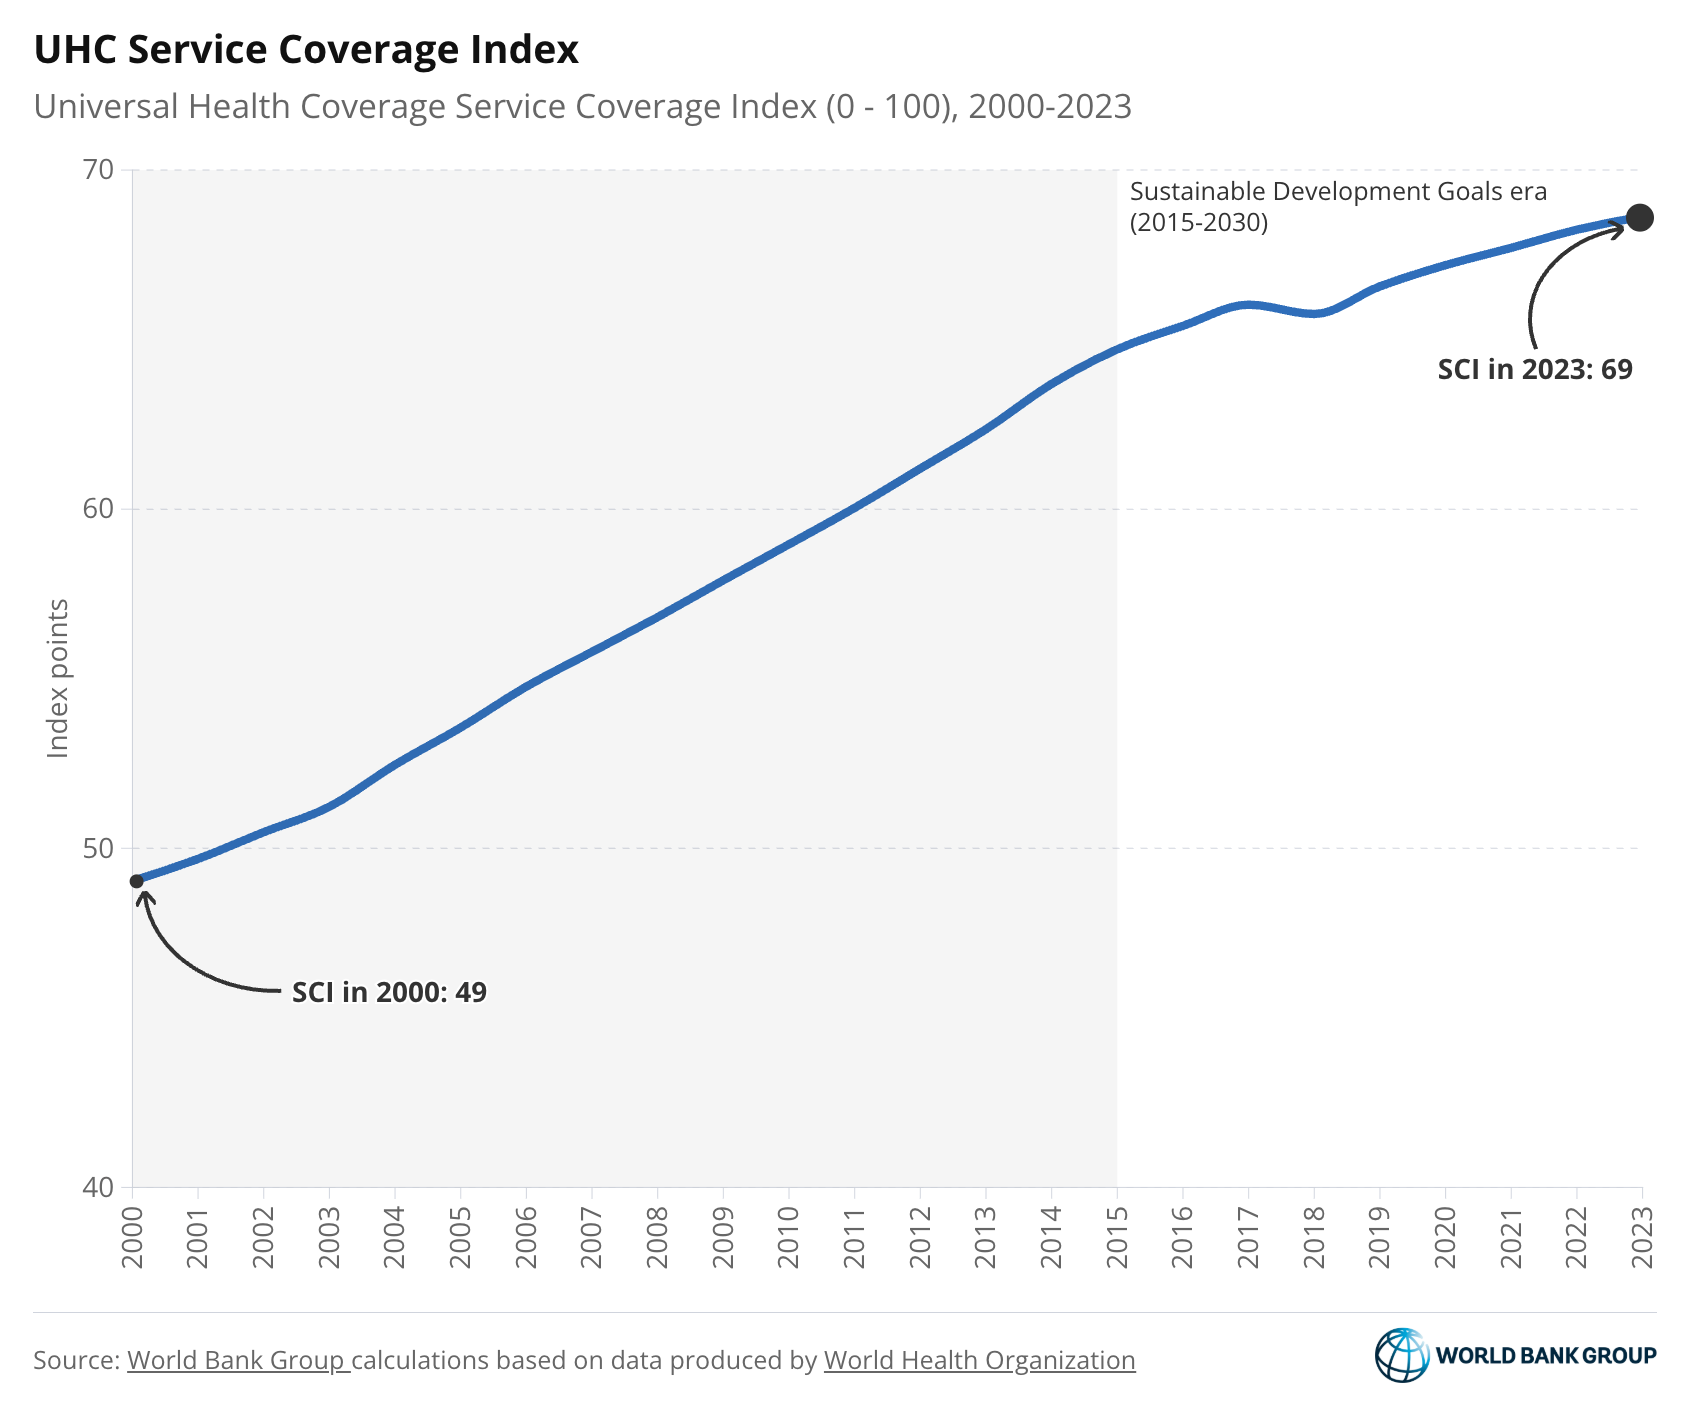
Universal Health Coverage
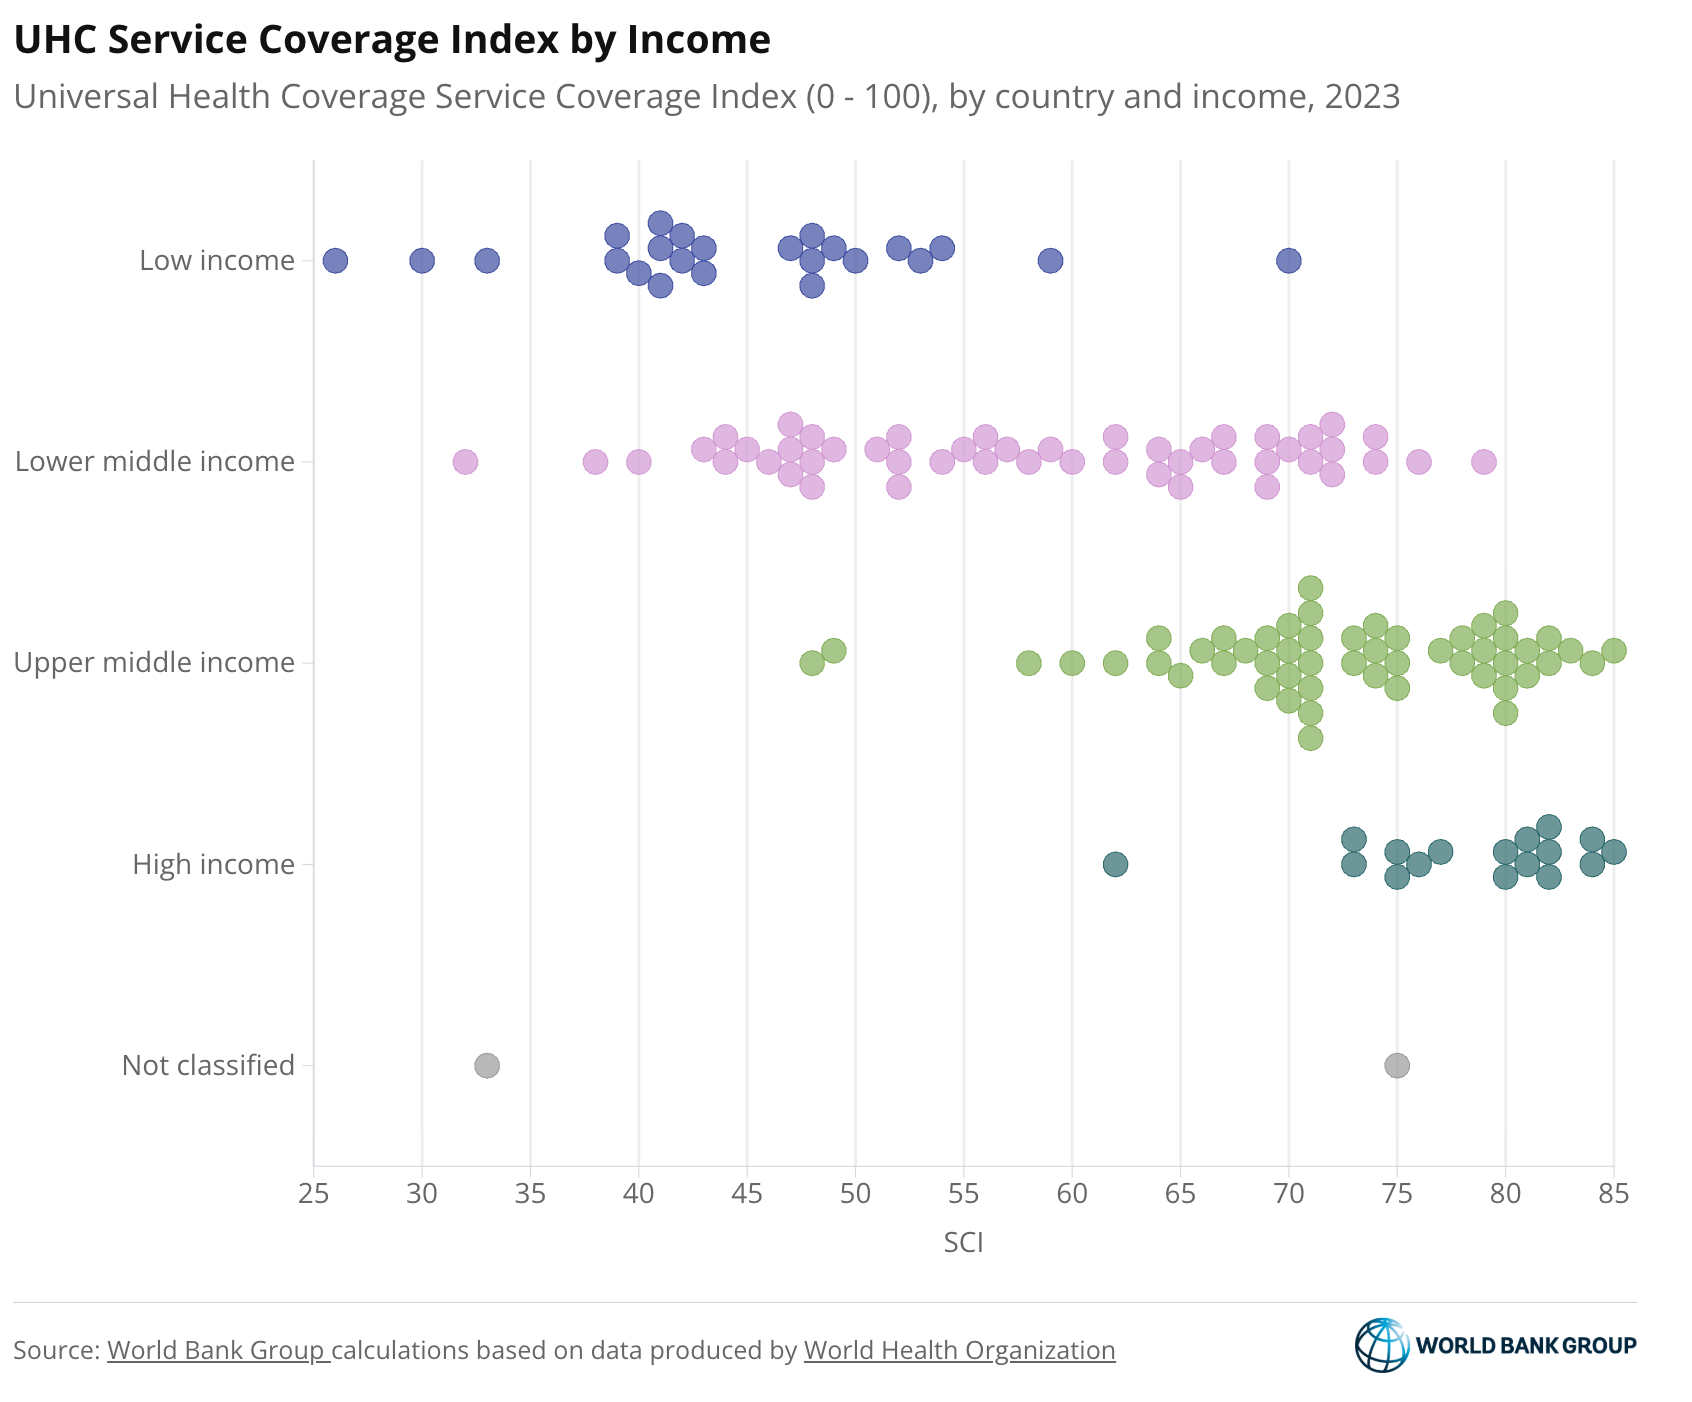
Universal Health Coverage (UHC), ensuring that people—including the poorest and most vulnerable—can obtain the care they need without incurring financial hardship, is a core global goal under the Sustainable Development Goals and central to the World Bank Group’s mission to end extreme poverty and boost shared prosperity on a livable planet. As part of this commitment, the World Bank Group has set a goal to help deliver affordable, quality health services to 1.5 billion people by 2030. The proportion of people in WBG client countries receiving essential health services has increased, with the UHC Service Coverage Index rising from 49 in 2000 to 69 in 2023. However, progress has slowed in the SDG era compared to earlier years. Inequalities in service coverage remain: most high-income countries have UHC SCI scores above 75, while many low-income countries remain below 50. Without faster progress, the world will fall short of achieving universal health coverage by 2030, and UHC will remain out of reach for many.
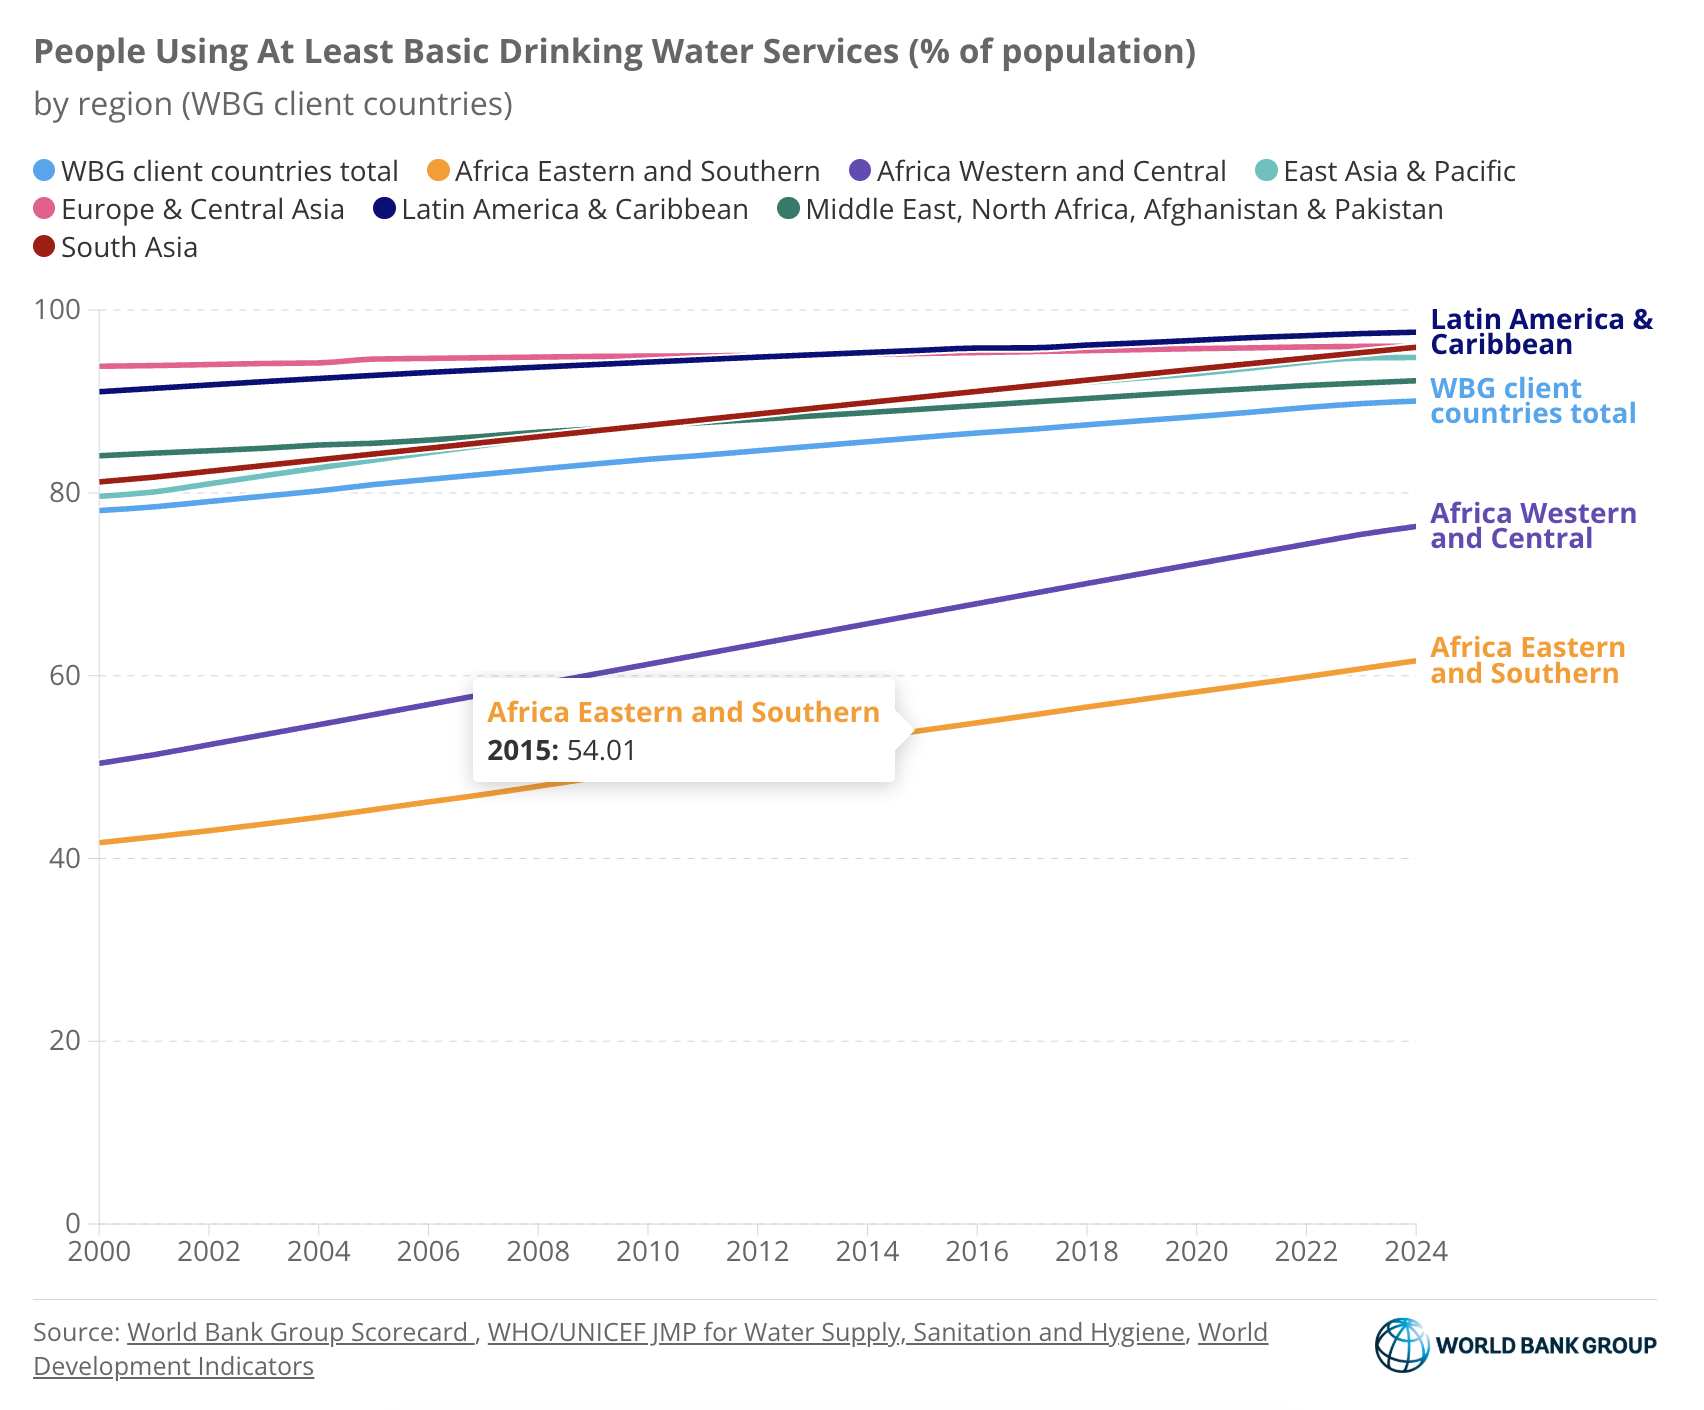
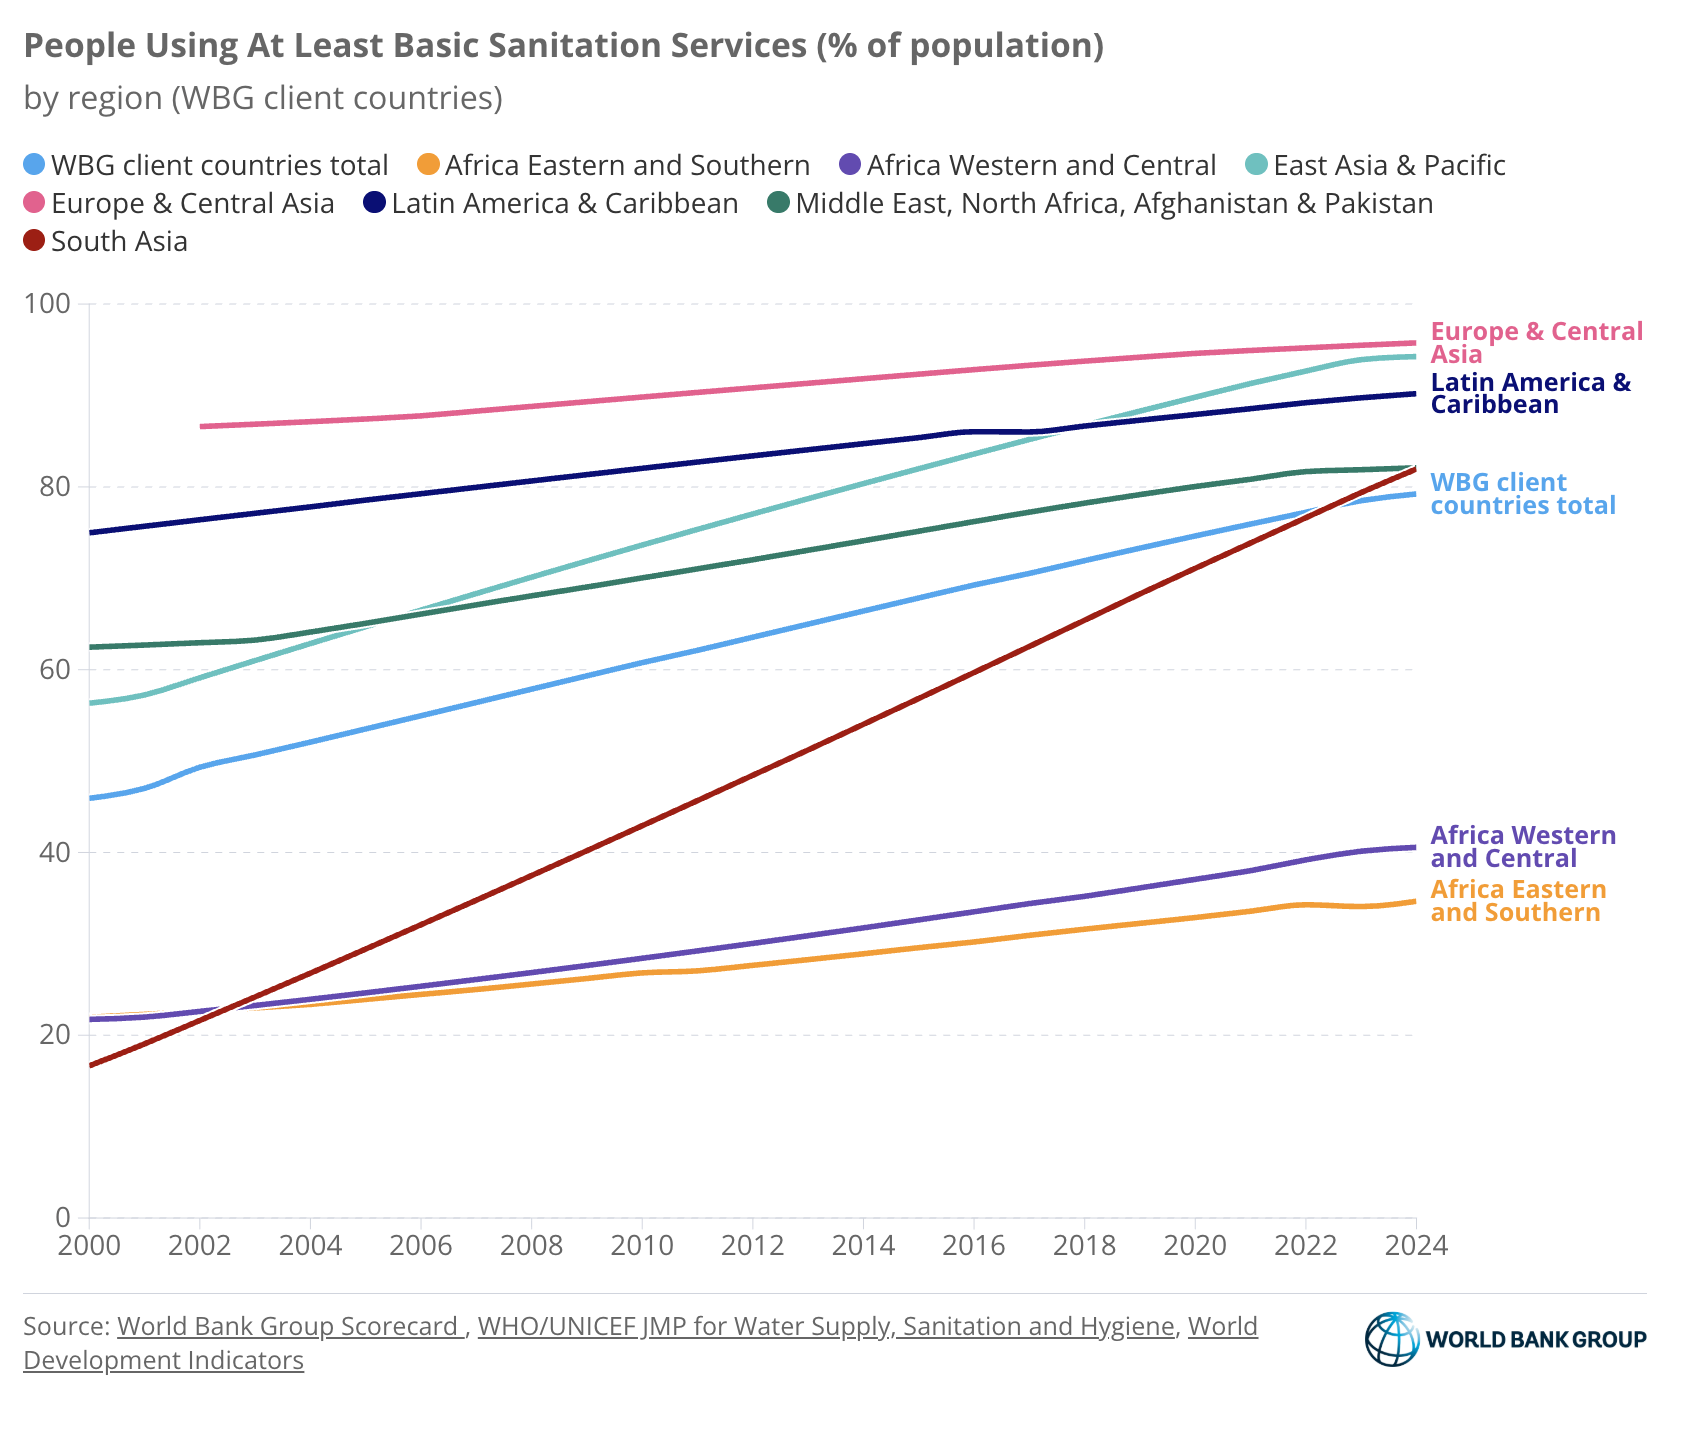
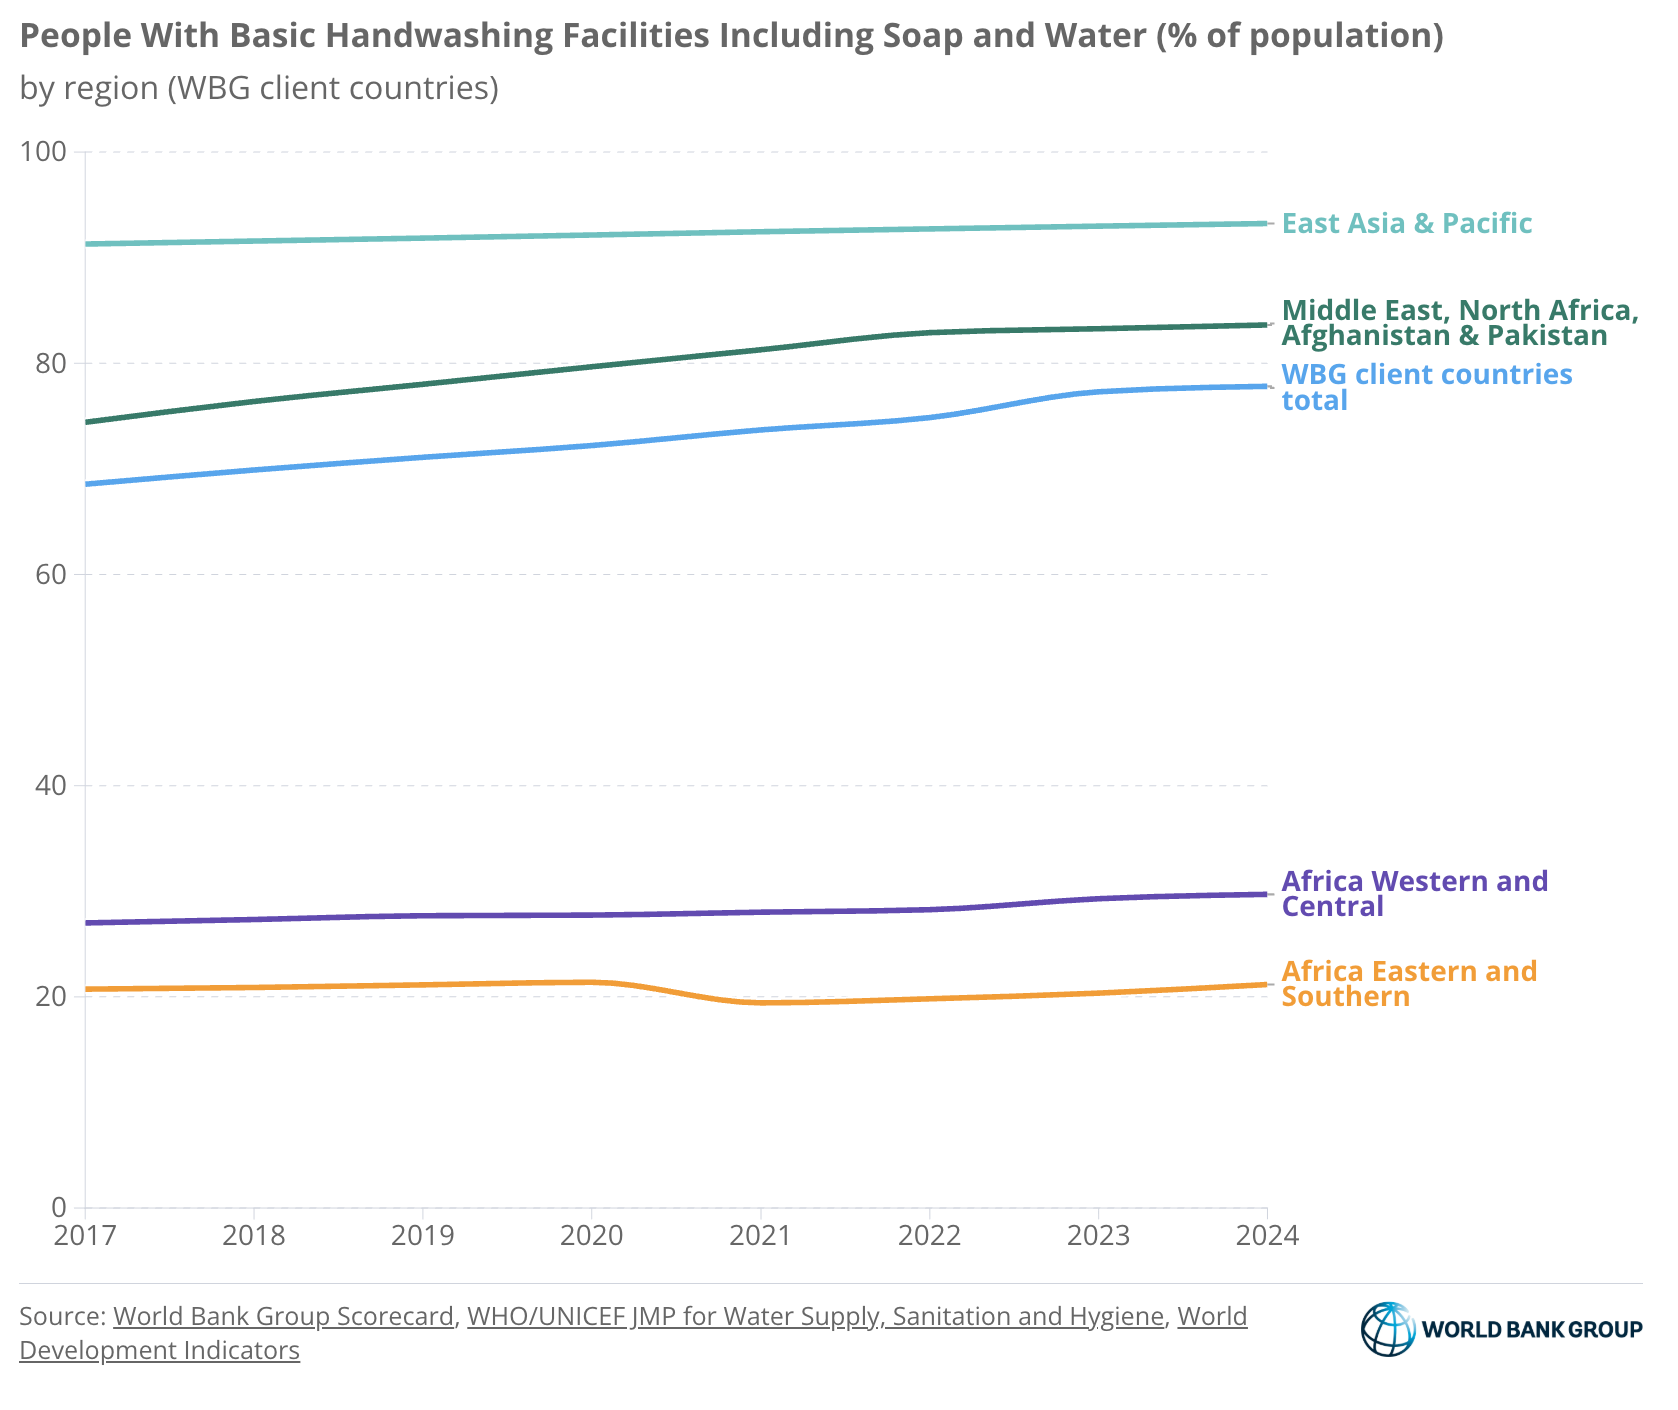
Percentage of people with access to basic drinking water, sanitation services, or hygiene
Access to water, sanitation, and hygiene (WASH) is a basic necessity for survival and for maintaining health and well-being1. Access to basic drinking water in World Bank Group client countries has improved steadily from 2000 to 2024, reaching about 90 percent of the population. Over the same period, access to basic sanitation increased more rapidly, from 46 percent to 80 percent. Access to basic handwashing facilities also improved, rising from 69 percent to 78 percent. However, progress has been uneven, with Eastern and Southern Africa and Western and Central Africa lagging behind other regions in WASH access.
3. Vulnerability Exposure
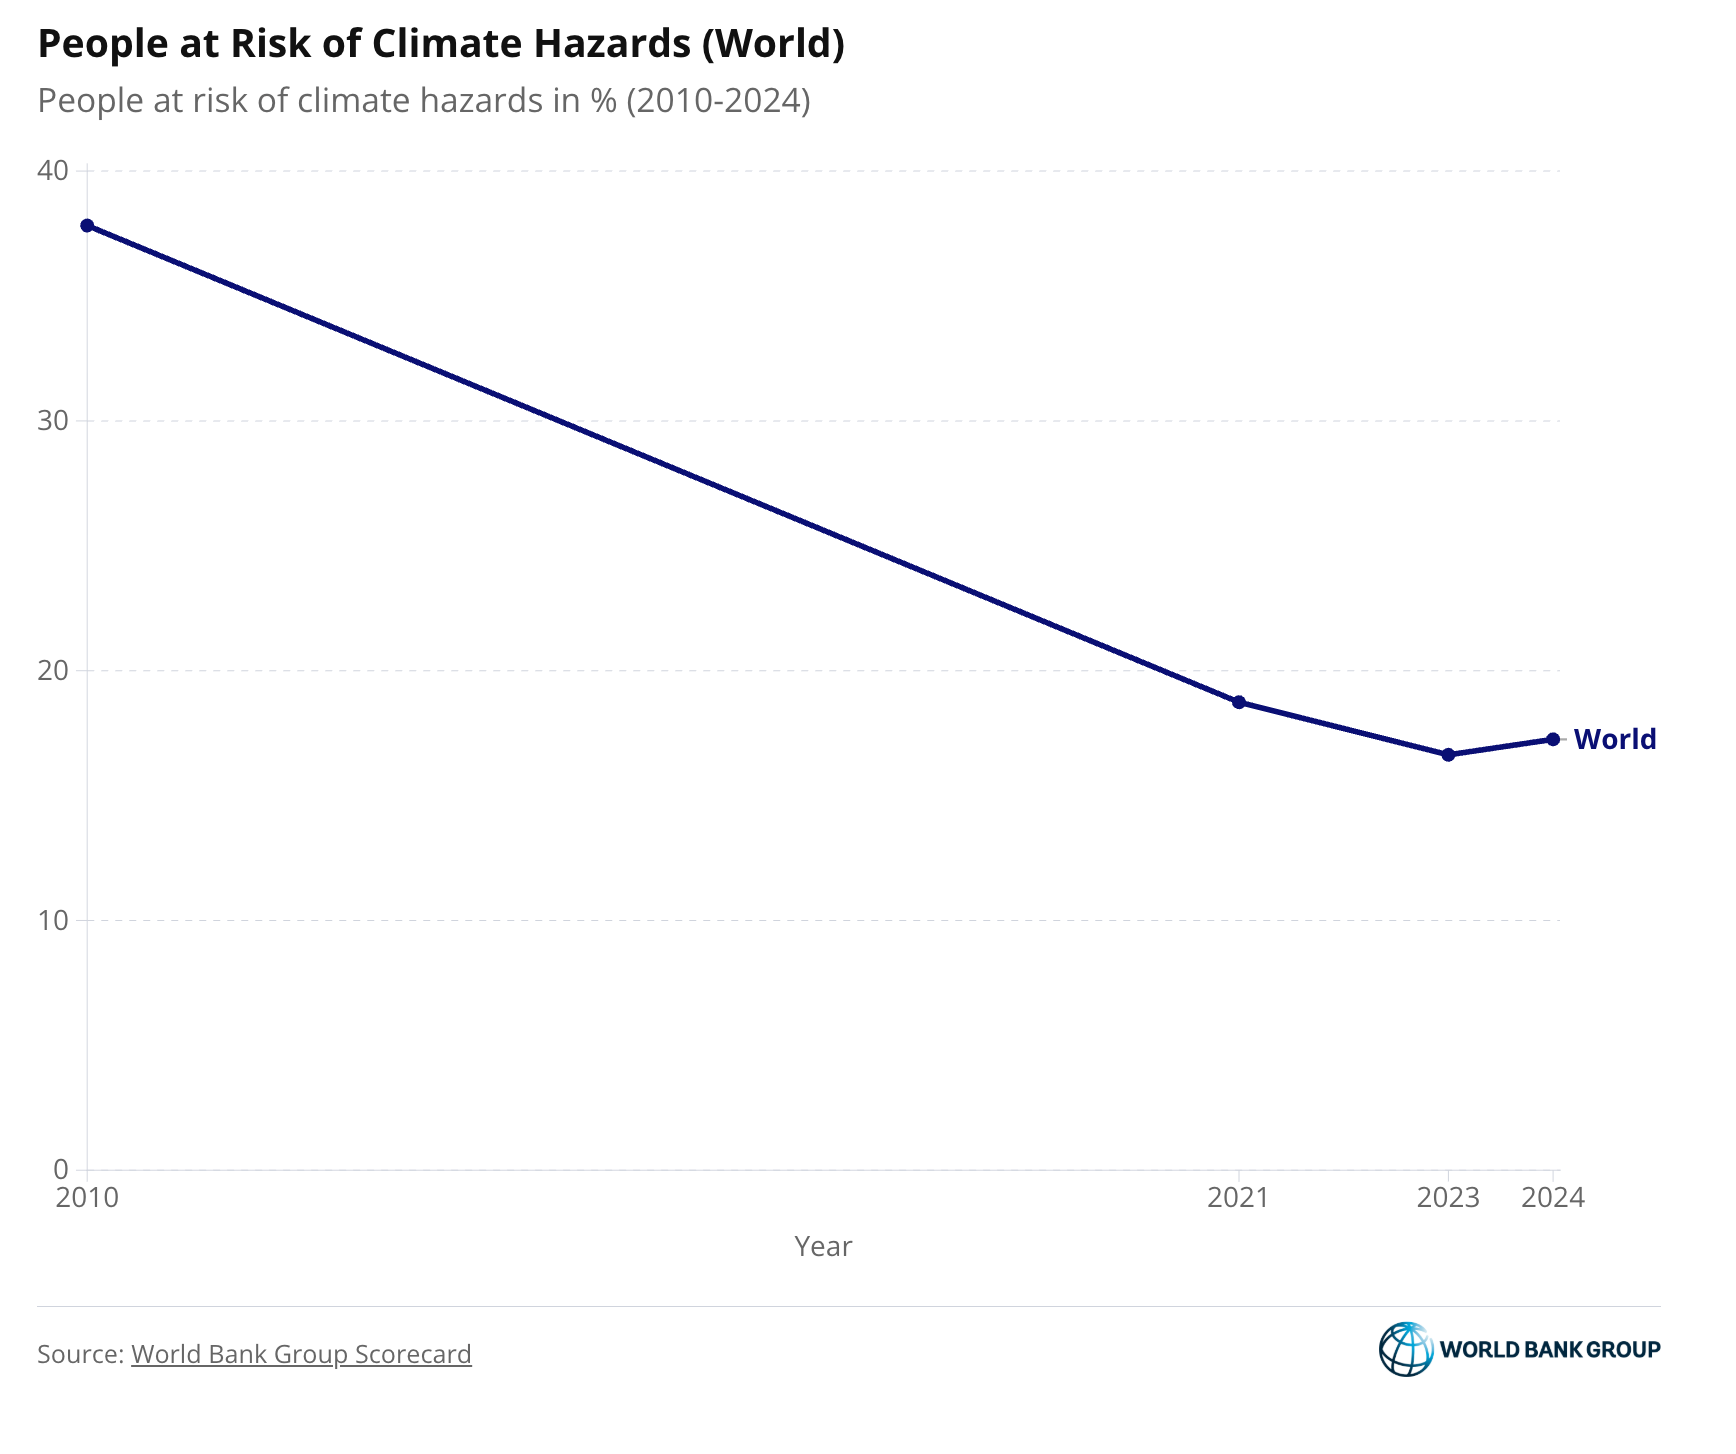
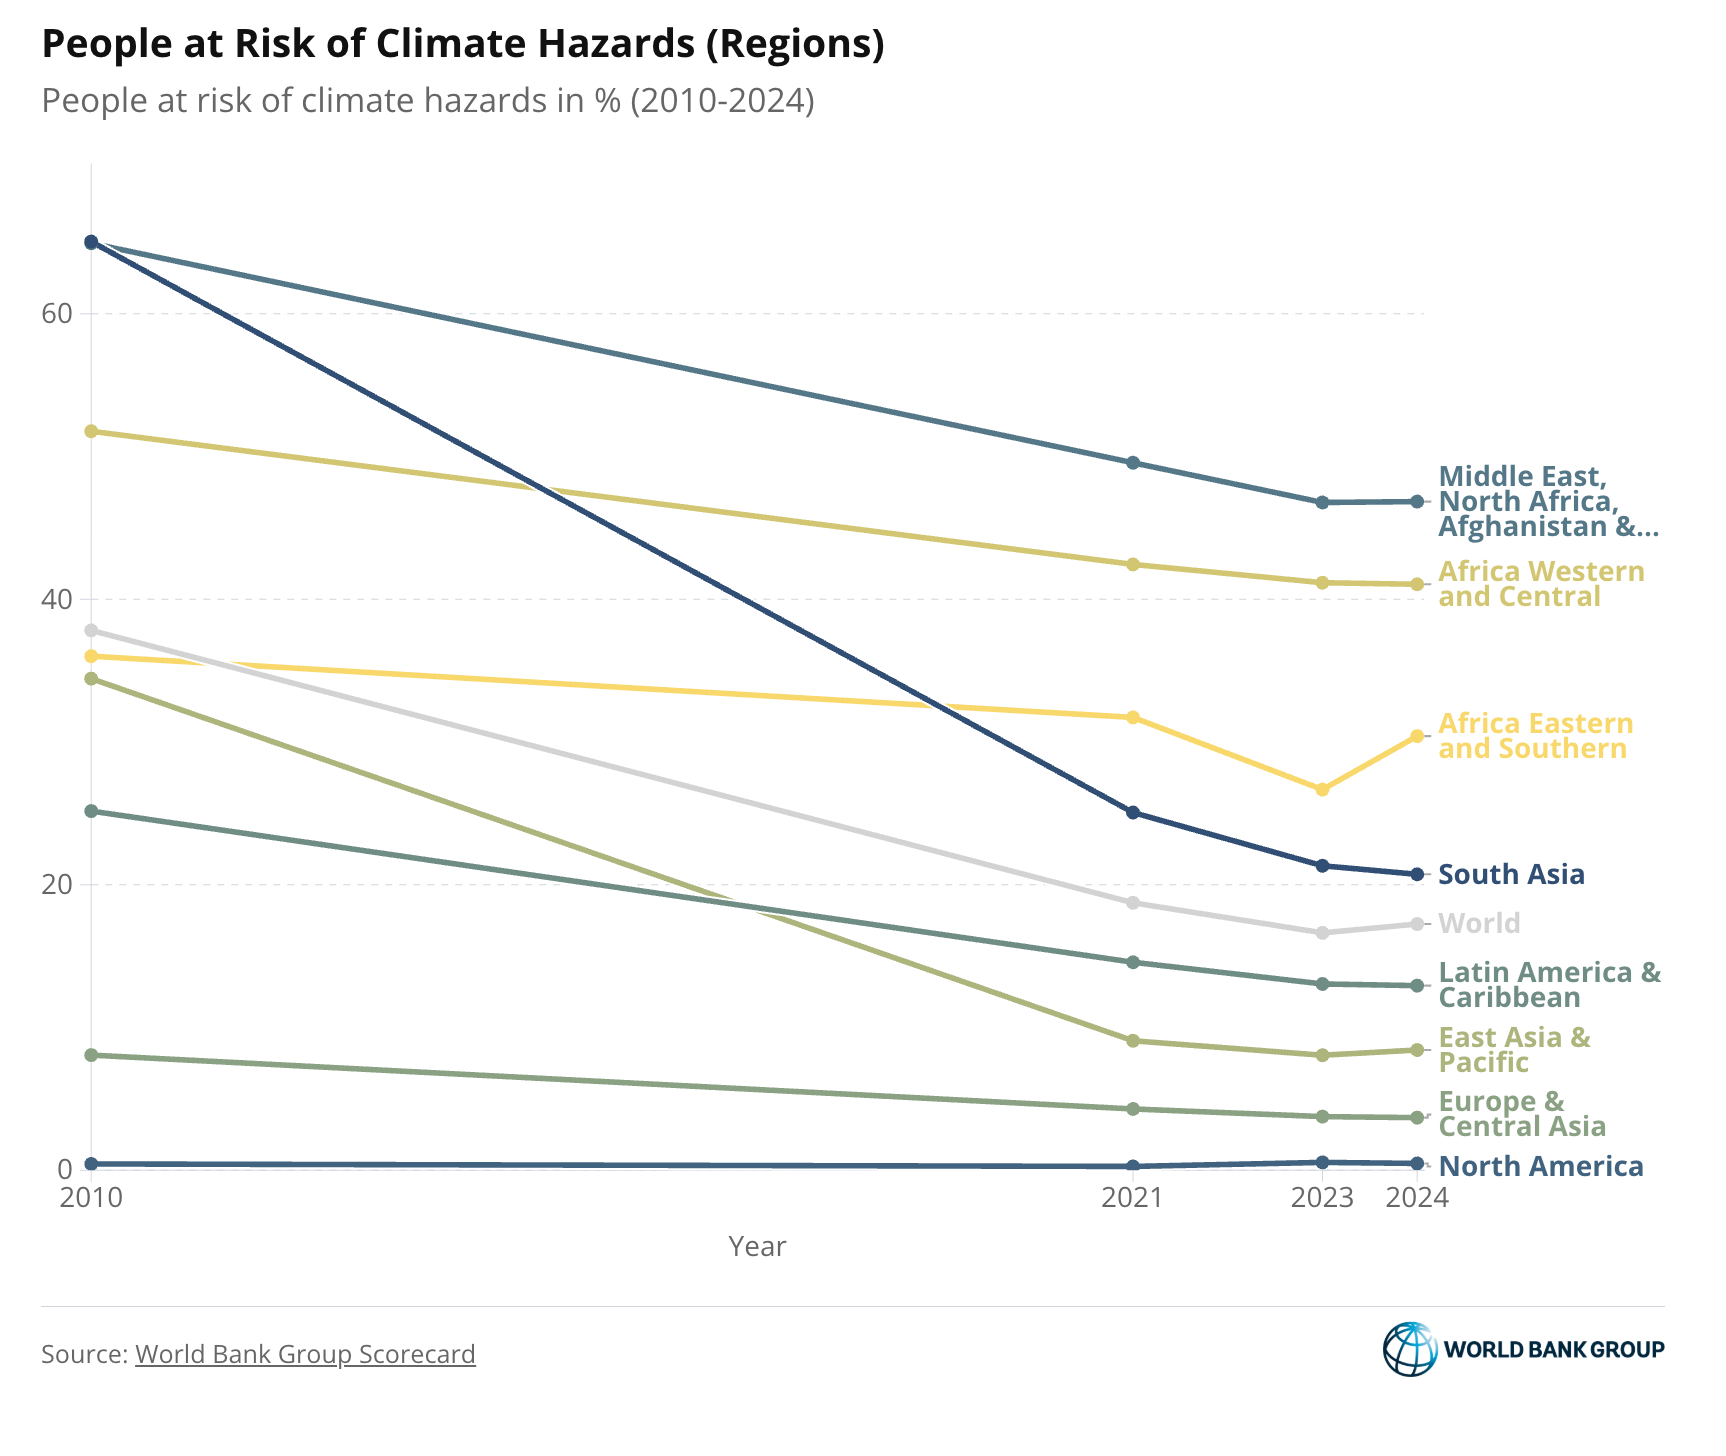
Percentage of people at high risk from climate-related hazards
Climate change causes and exacerbates many climate-related hazards, such as heatwaves, floods, droughts and storms and a large part of the global population is exposed to these. The effect on people’s livelihood of these hazards depends on their vulnerability to these shocks. Therefore, this indicator measures which share of the population is both exposed as well as vulnerable to climate-related hazards. People are classified as being at high risk if they are exposed to at least one major climate-related hazard (floods, droughts, cyclones, or heatwaves), and are vulnerable along at least one dimension that limits their ability to cope with or recover from shocks. Vulnerability reflects both physical constraints (such as limited mobility or lack of access to basic infrastructure like water and electricity) and socioeconomic factors (including low income, limited education, lack of access to financial services, and absence of social protection). The share of the population at high risk of climate-related hazards halved between 2010 and 2024. This reduction is achieved by reducing vulnerability, such as improving access to electricity and getting people out of poverty.
Why this matters
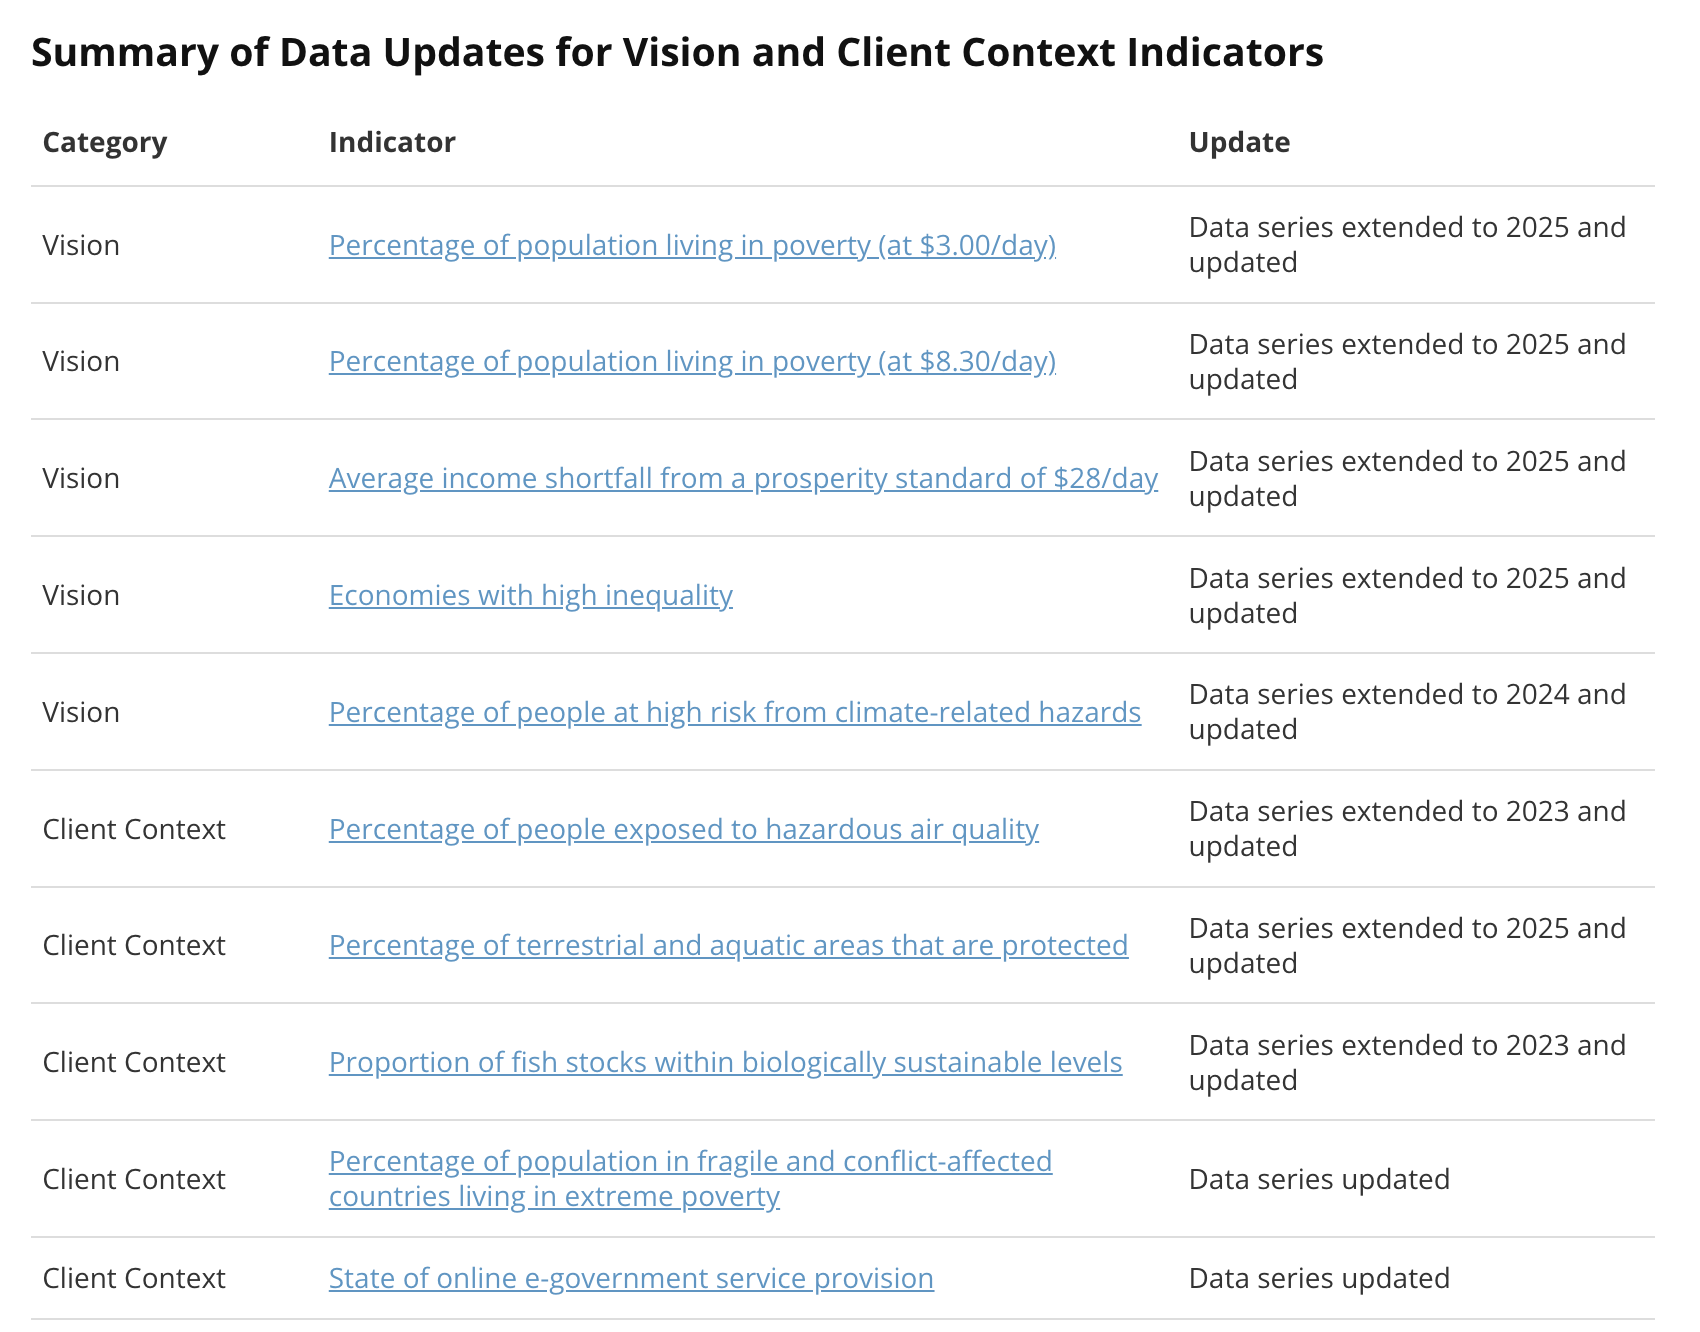
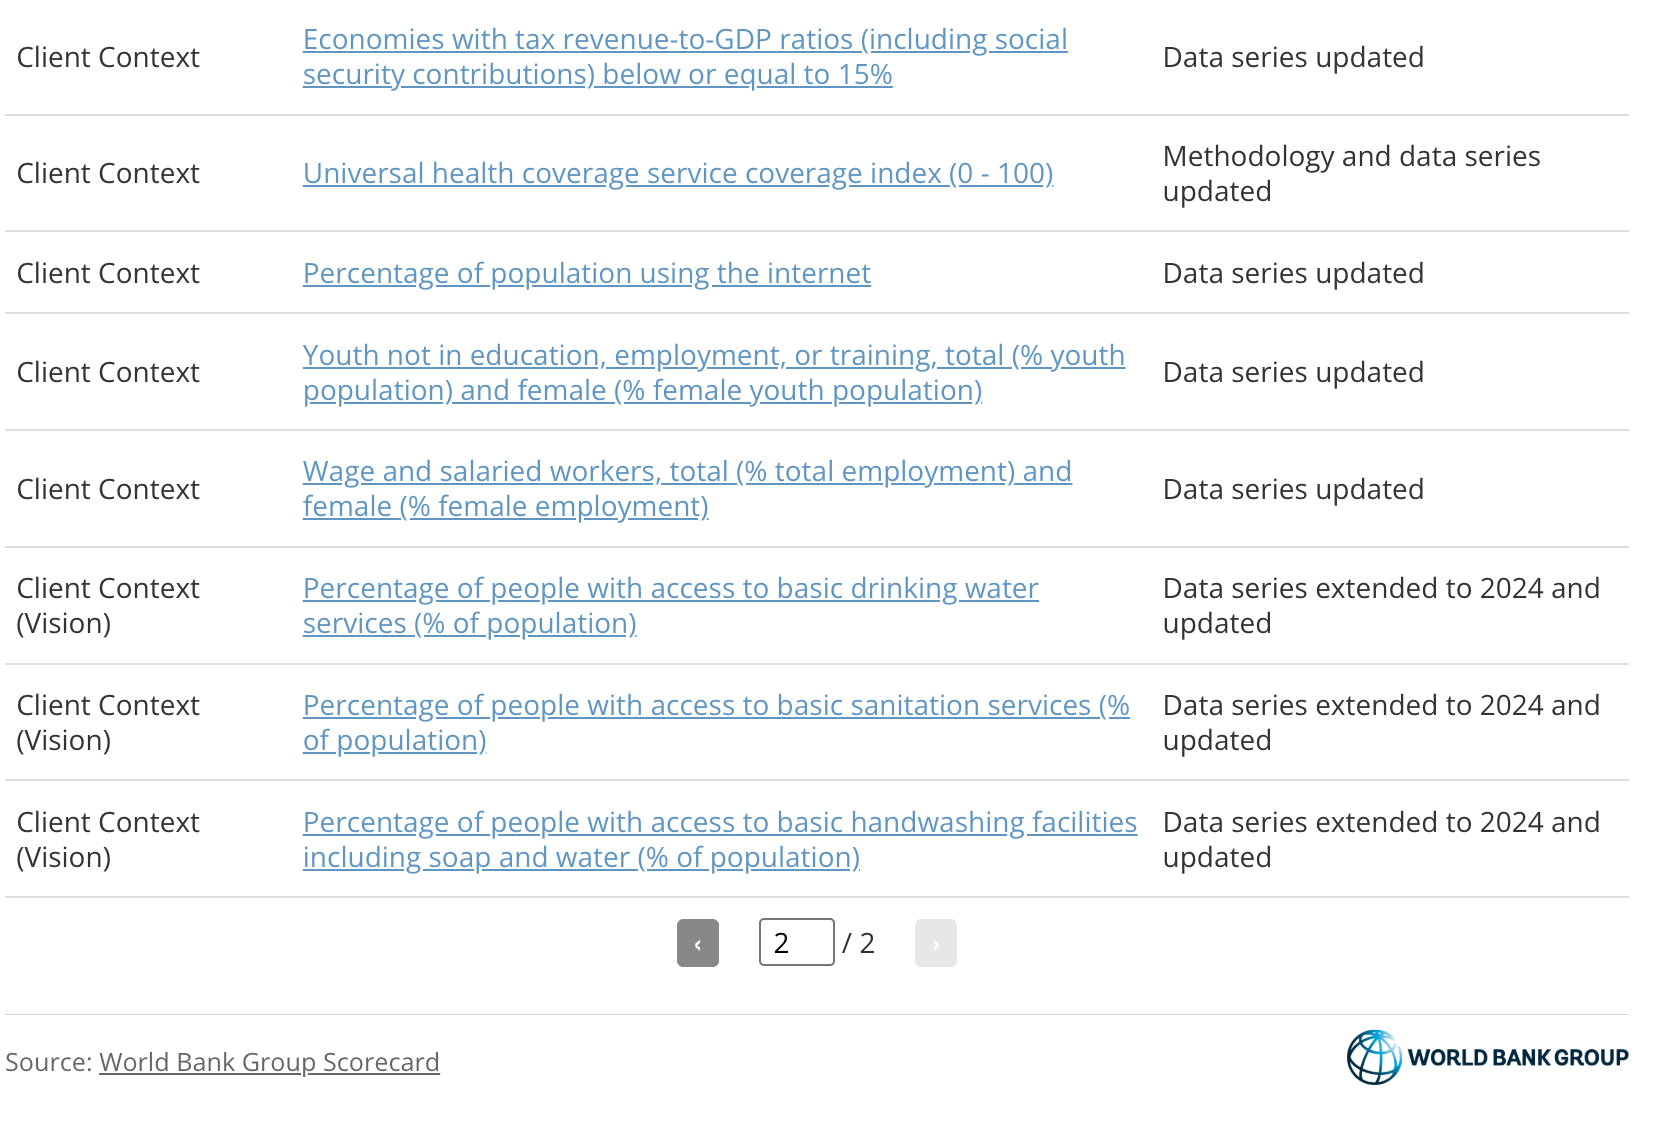
The latest Scorecard update reinforces the importance of timely and transparent data for understanding development challenges and informing action. By showing where progress is being made and where gaps remain, these indicators provide an essential evidence base for policy, investment, and accountability. Behind each data point are people, communities, and livelihoods, underscoring why continued attention to inclusive and effective development outcomes matters. Table 1 presents the latest data updates for the Client Context and Vision indicators.
The World Bank Group Scorecard is accessible via this page. The data can be further studied using the World Bank Group Scorecard Explorer.
[1] These services are classified into a few service levels. For water and sanitation, we monitor the share of people using at least basic services—defined as access to improved water sources within a 30-minute round-trip collection time, and improved sanitation facilities not shared with other households (at least basic’ services include both basic and safely managed service levels, following the WHO/UNICEF Joint Monitoring Programme (JMP) classification. Reference: https://washdata.org/). For hand hygiene, the focus is on access to basic handwashing facilities, defined as a facility with soap and water available at home.
[A] The term country, used interchangeably with economy, does not imply political independence but refers to any territory for which authorities report separate social or economic statistics.
Acknowledgements: We thank our colleagues and collaborators for their valuable feedback and support. We are grateful to Gil Shapira (WKHH1) for their contributions.