World Bank Group
WBG
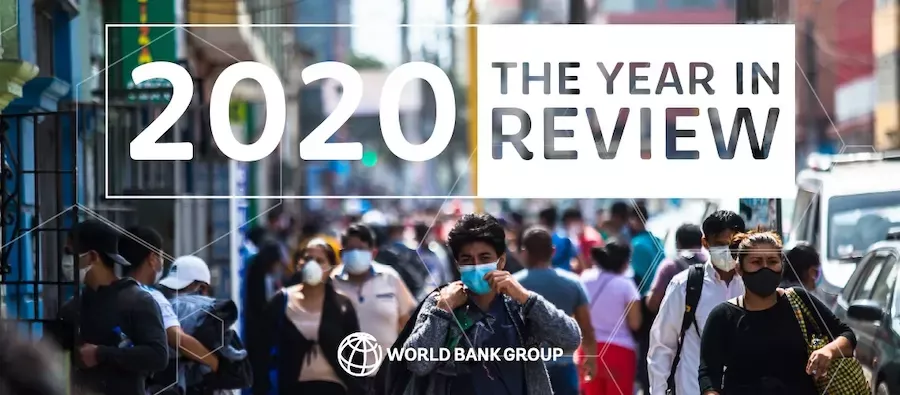
2020 Year in Review: The impact of COVID-19 in 12 charts
This time last year, concepts such as “lockdowns,” “mask mandates” and “social distancing” were unknown to most of us. Today they are part of our everyday language as the COVID-19 pandemic continues to impact all aspects of our lives. Through the following 12 charts and graphics, we try to quantify and provide an overview of our colleagues’ research in the face of a truly unprecedented crisis.
The New Poor
Accelerated Economic Downturn
Relieving the Debt Burden
Migrants Sending Less Money Home
Impact on Businesses and Jobs
The High Cost of Health Care
Closing Classrooms
Internet Inequalities
Gender Distinctions
Millions More Without Meals
Fragility, Conflict, Violence: Home to More and More Poor
Seizing the Sustainability Opportunity
Previously posted at: