The most recent figures for 2023 indicate that cross-border payments for the use of intellectual property (IP) reached more than 1 trillion USD, more than doubling since 2010 and growing at an average compound annual rate of approximately 5.5 percent between 2010 and 2022 (see Figure 1).
Figure 1: Cross-border payments for the export and import of intellectual property, in USD Billion, 2010-2023
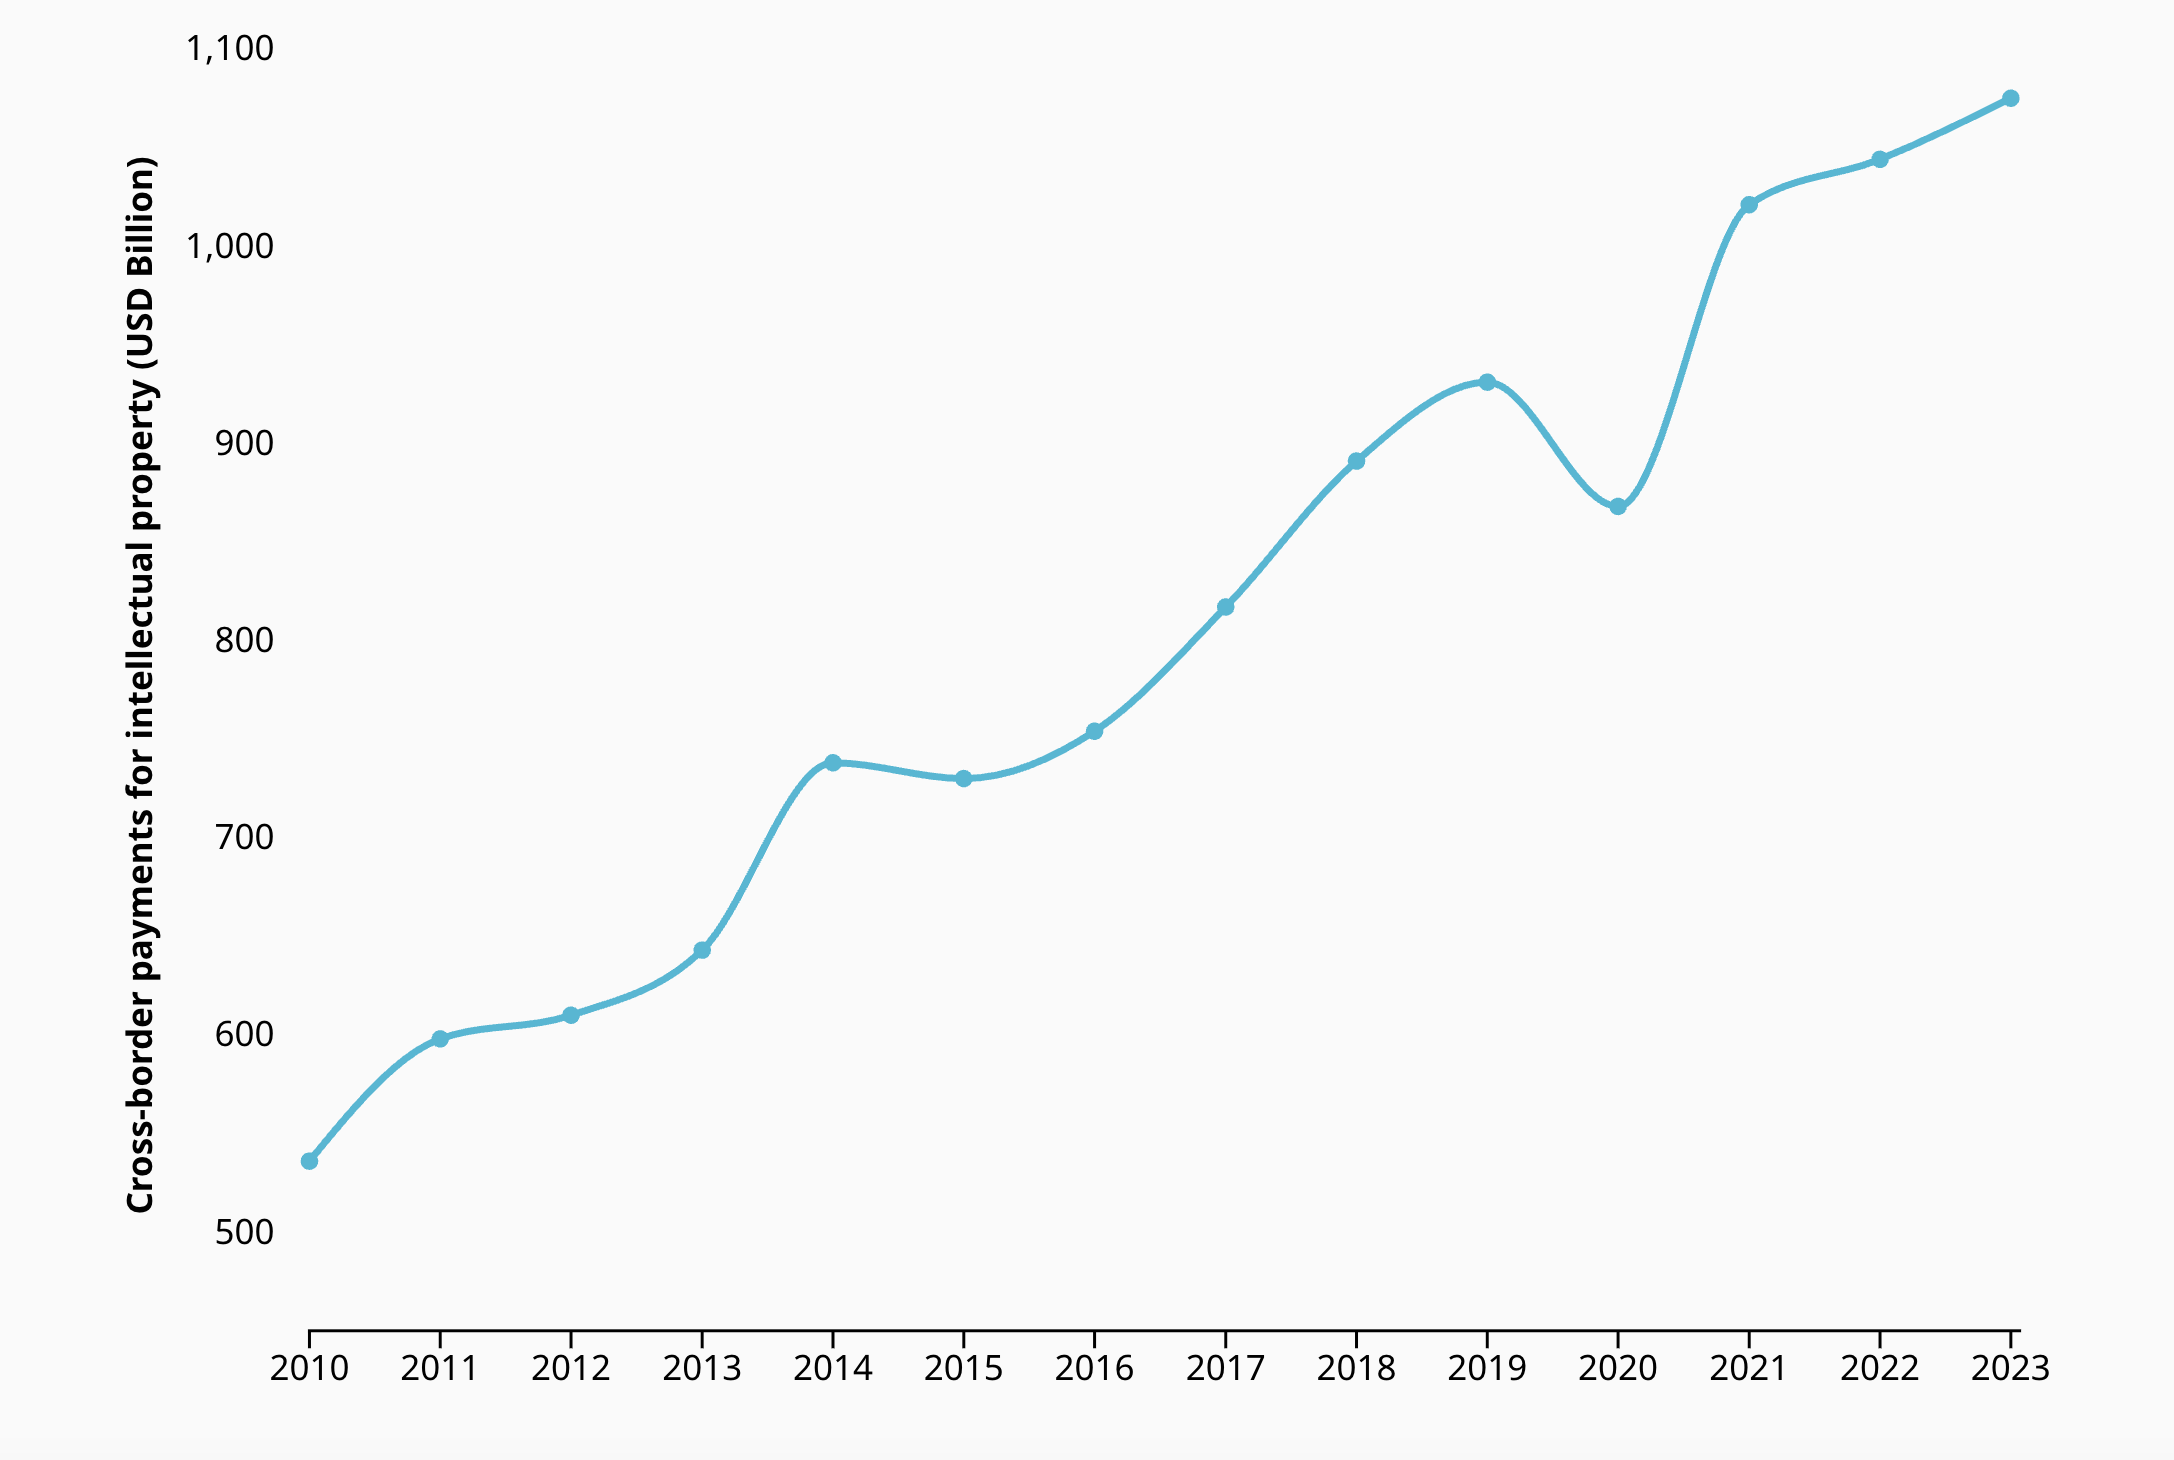
Cross-border payments for IP have expanded considerably as global economies have become increasingly interconnected. This growing global trade in IP reflects how production has been restructured, with business activities spreading across multiple countries and companies depending more heavily on intangible assets such as technological knowledge and software, thereby leading to an increase in intellectual property cross-border activity.[1]
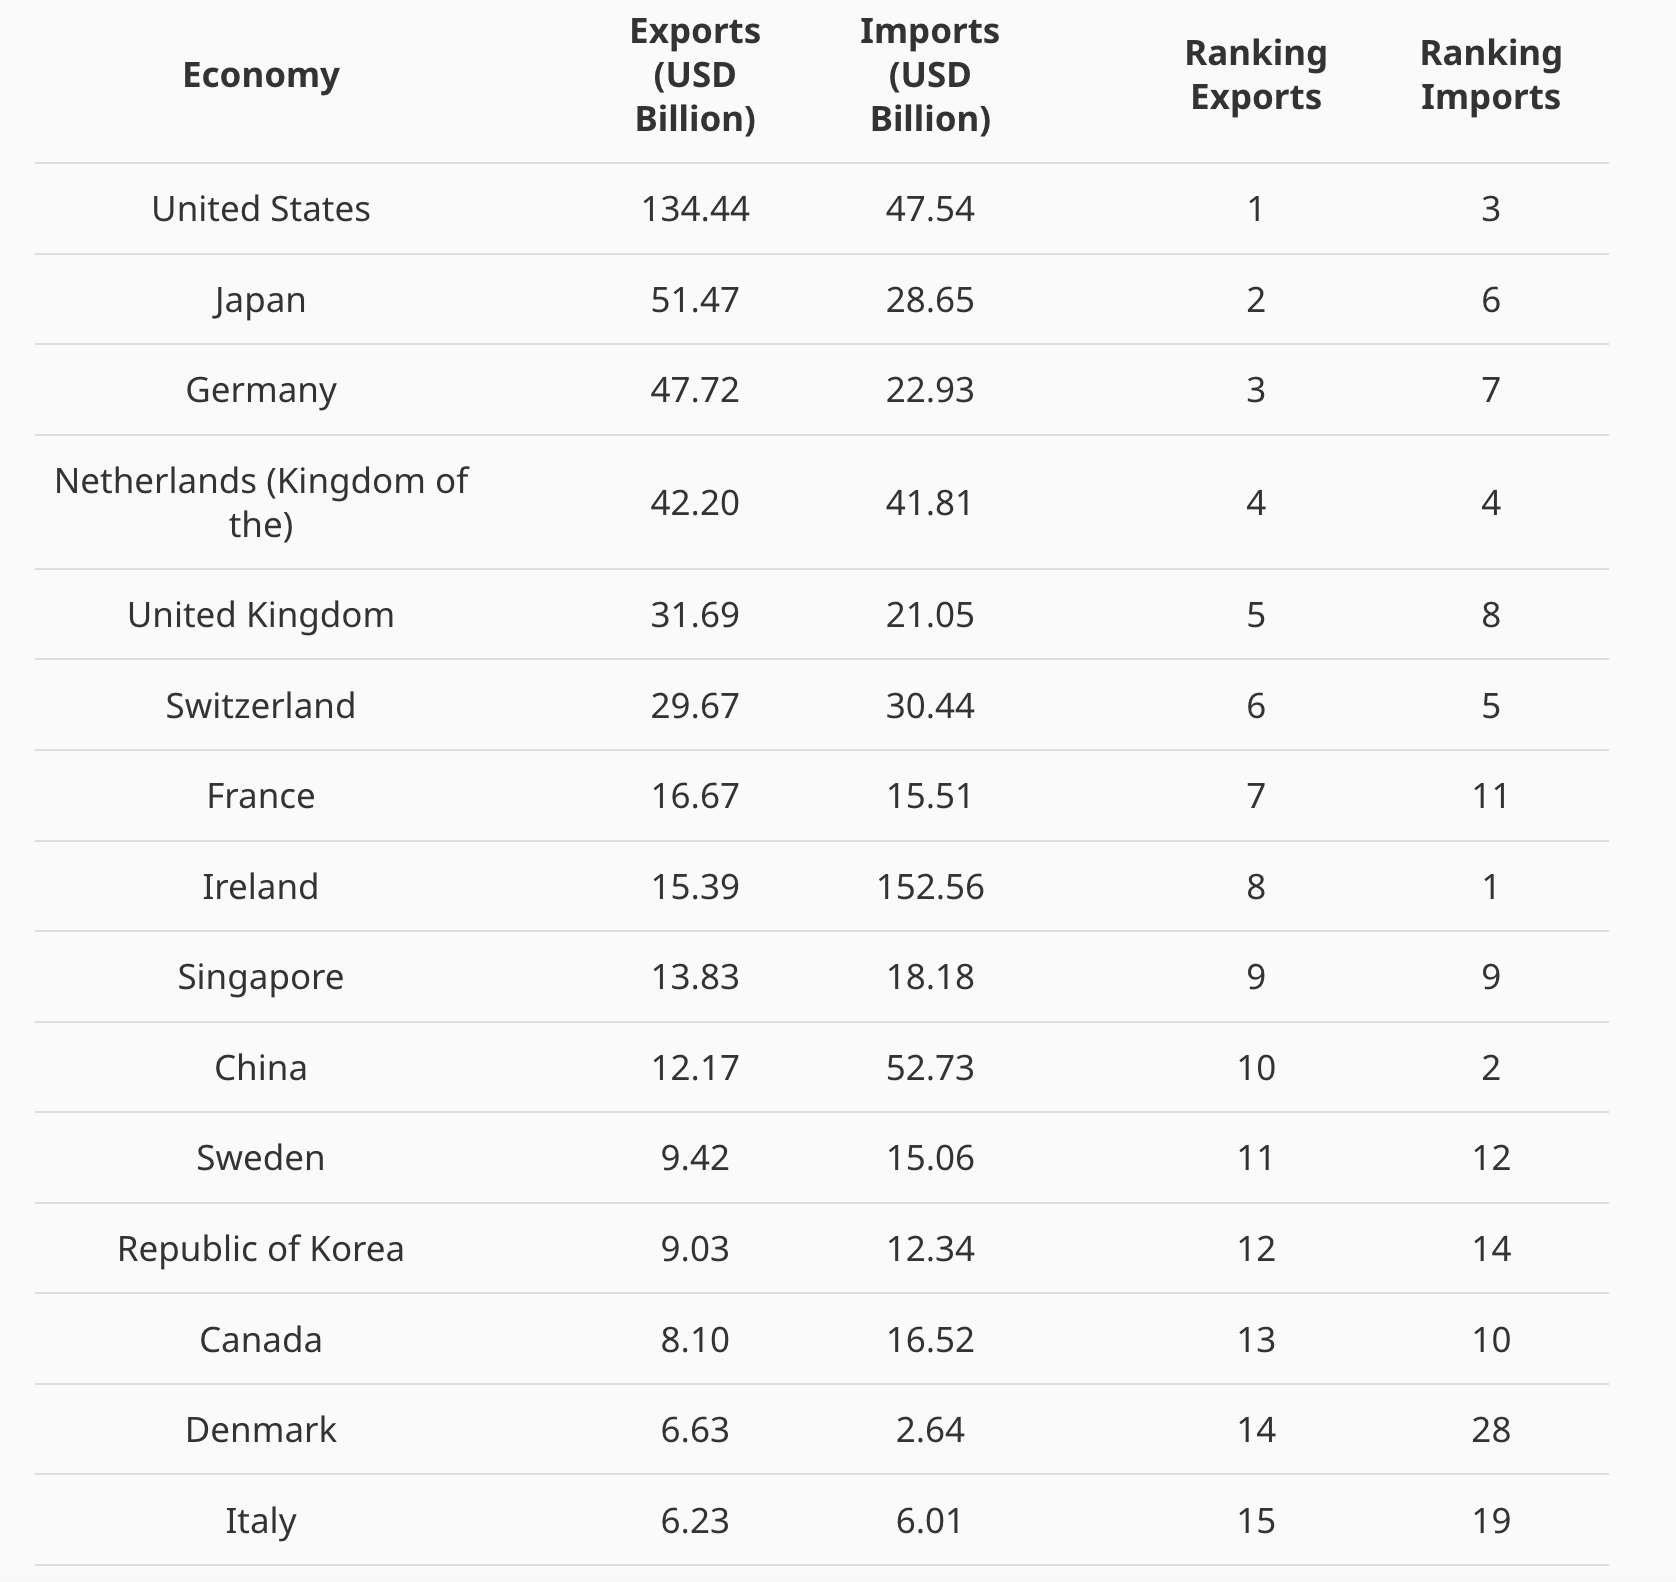
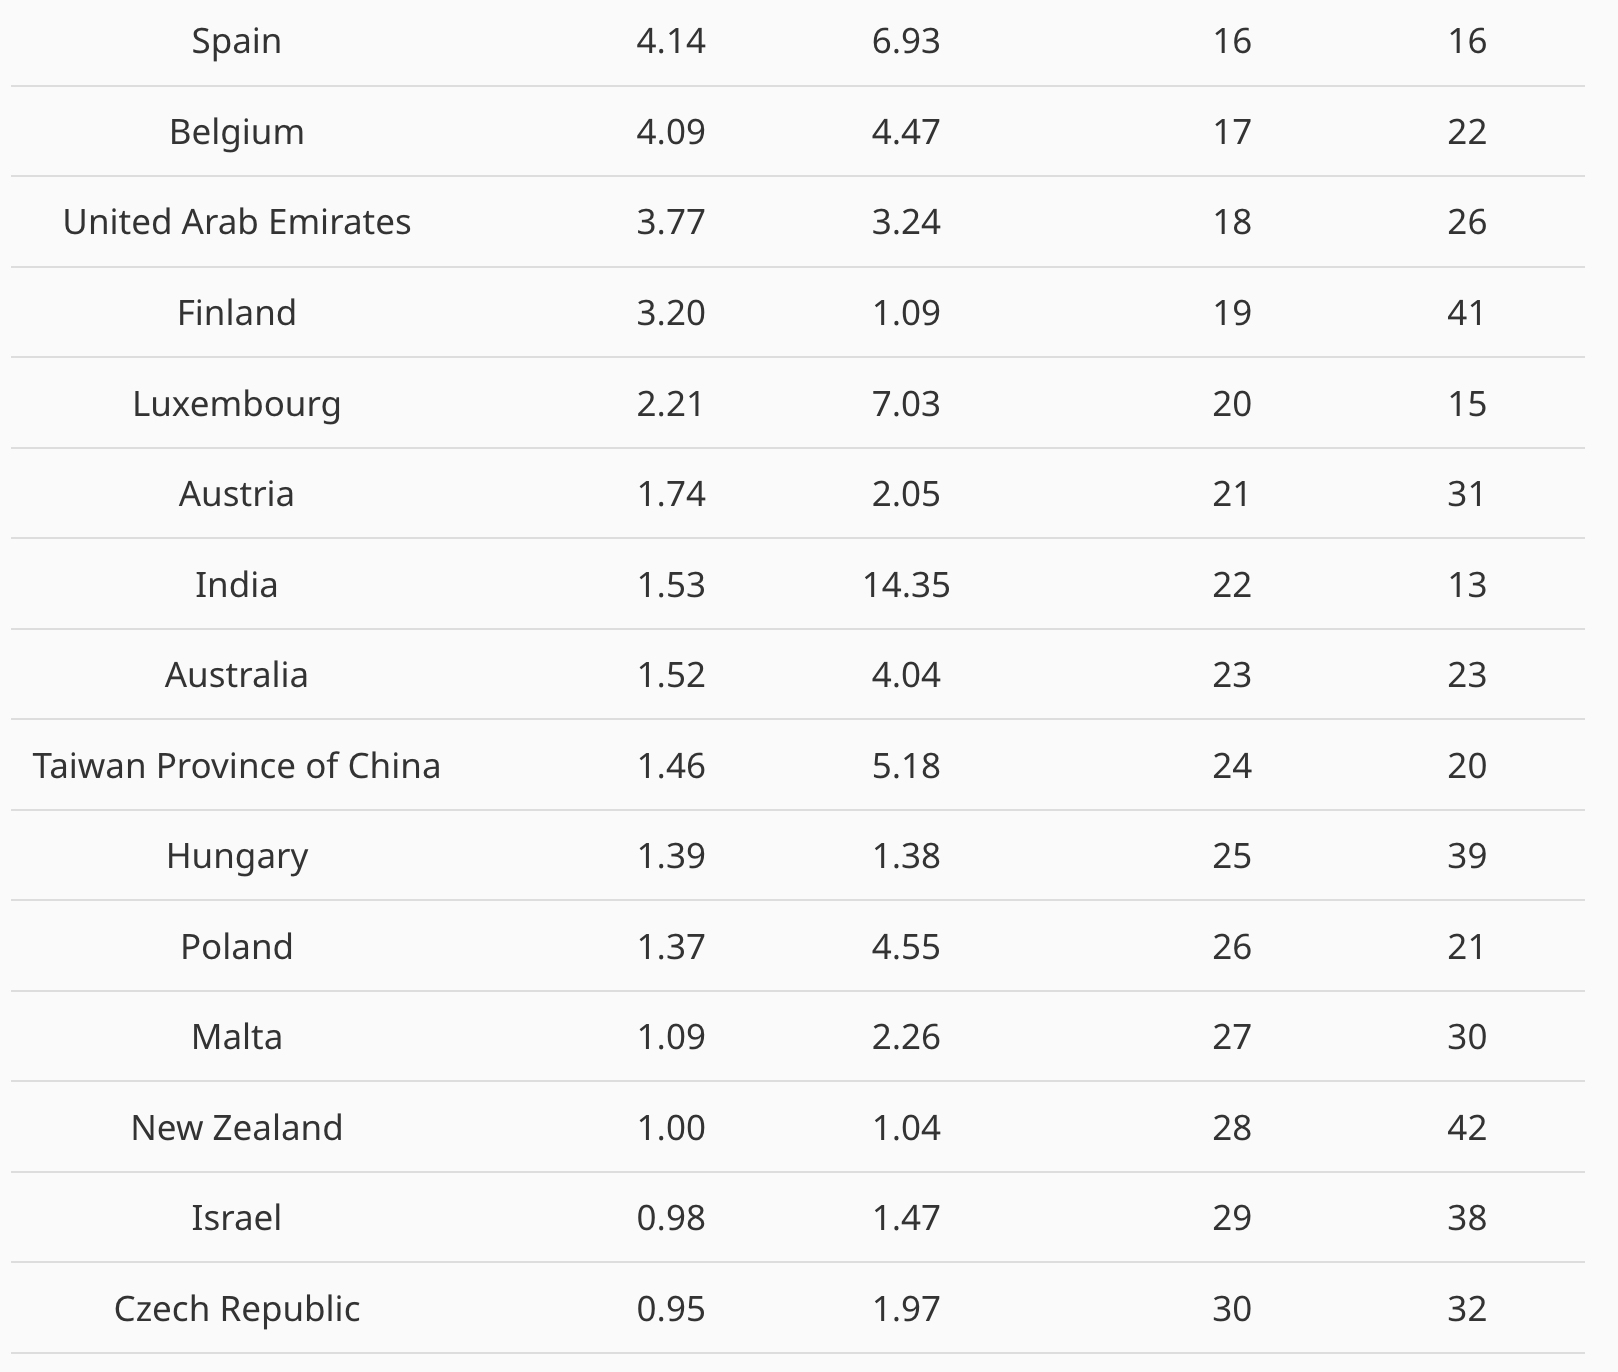
The United States, Japan, Germany, The Netherlands and the United Kingdom lead in IP exports (see Table 1) whereas Ireland, China, the United States, the Netherlands and Switzerland lead in IP imports. China, ranked 10th among the world’s leading IP exporters, is the only emerging economy in the top 20. Also, a few emerging economies feature among the top 20 IP importers such as China (2nd), India (13th), Brazil (17th), and Thailand (18th).
In general Table 1 shows that strong IP importers are almost always strong IP exporters too. In fact, 9 of the top 10 IP exporters are also in the top 10 for imports in 2023, with only France (7th in exports, 11th in imports) narrowly missing the top 10 IP importers. Middle-income economies like China (10th largest exporter, 2nd largest importer) and India (22nd in exports, 13th in imports) exemplify how emerging innovation economies actively engage in IP markets as they develop their technological capabilities and the absorptive capacity of their domestic research institutions and enterprises. Evidently, net IP payment positions reflect a variety of influences, including evolving specialization patterns in technology and creative content, incipient innovation and creative economy capabilities, but also – as noted in our second point – measurement challenges.
Table 1: Global IP Receipts and Payments, Balance, in USD Billion, 2023
Before detailing some of the results, it is useful to recall the components of IP trade:[2][3]
- Franchises and trademarks licensing fees: Example: Payments to an international fast-food chain for the rights to operate restaurants. These payments allow local businesses to benefit from a globally recognized brand and quality assurance, helping them scale and create domestic employment.
- Licenses for the use of outcomes of research and development (R&D): Example: Payments to a biotech company for the use of patented pharmaceutical formulations. Enables domestic pharma producers to bring innovative medicines to the national market quickly, possibly improving public health outcomes without the need to invest in R&D infrastructure upfront.
- Licenses to reproduce and/or distribute computer software: Payments for access to advanced enterprise resource planning (ERP) systems. Strengthens the productivity of local firms through access to state-of-the-art digital tools and management systems.
- Licenses to reproduce and/or distribute audiovisual products: Payments to international studios for rights to distribute movies or educational content locally. Broadens cultural offerings and educational content available to the public.
- Other such payments for IP rights such as industrial designs, copyrights, etc. Payments for the rights to use industrial designs in the local production of consumer electronics. Supports local manufacturing industries in offering more attractive, high-quality products, enhancing export potential.
IP payments abroad can thus be framed as an investment in upgrading domestic capabilities—by accessing better technologies, brands, and creative content—rather than as a passive outflow.
Relative IP trade intensity analysis
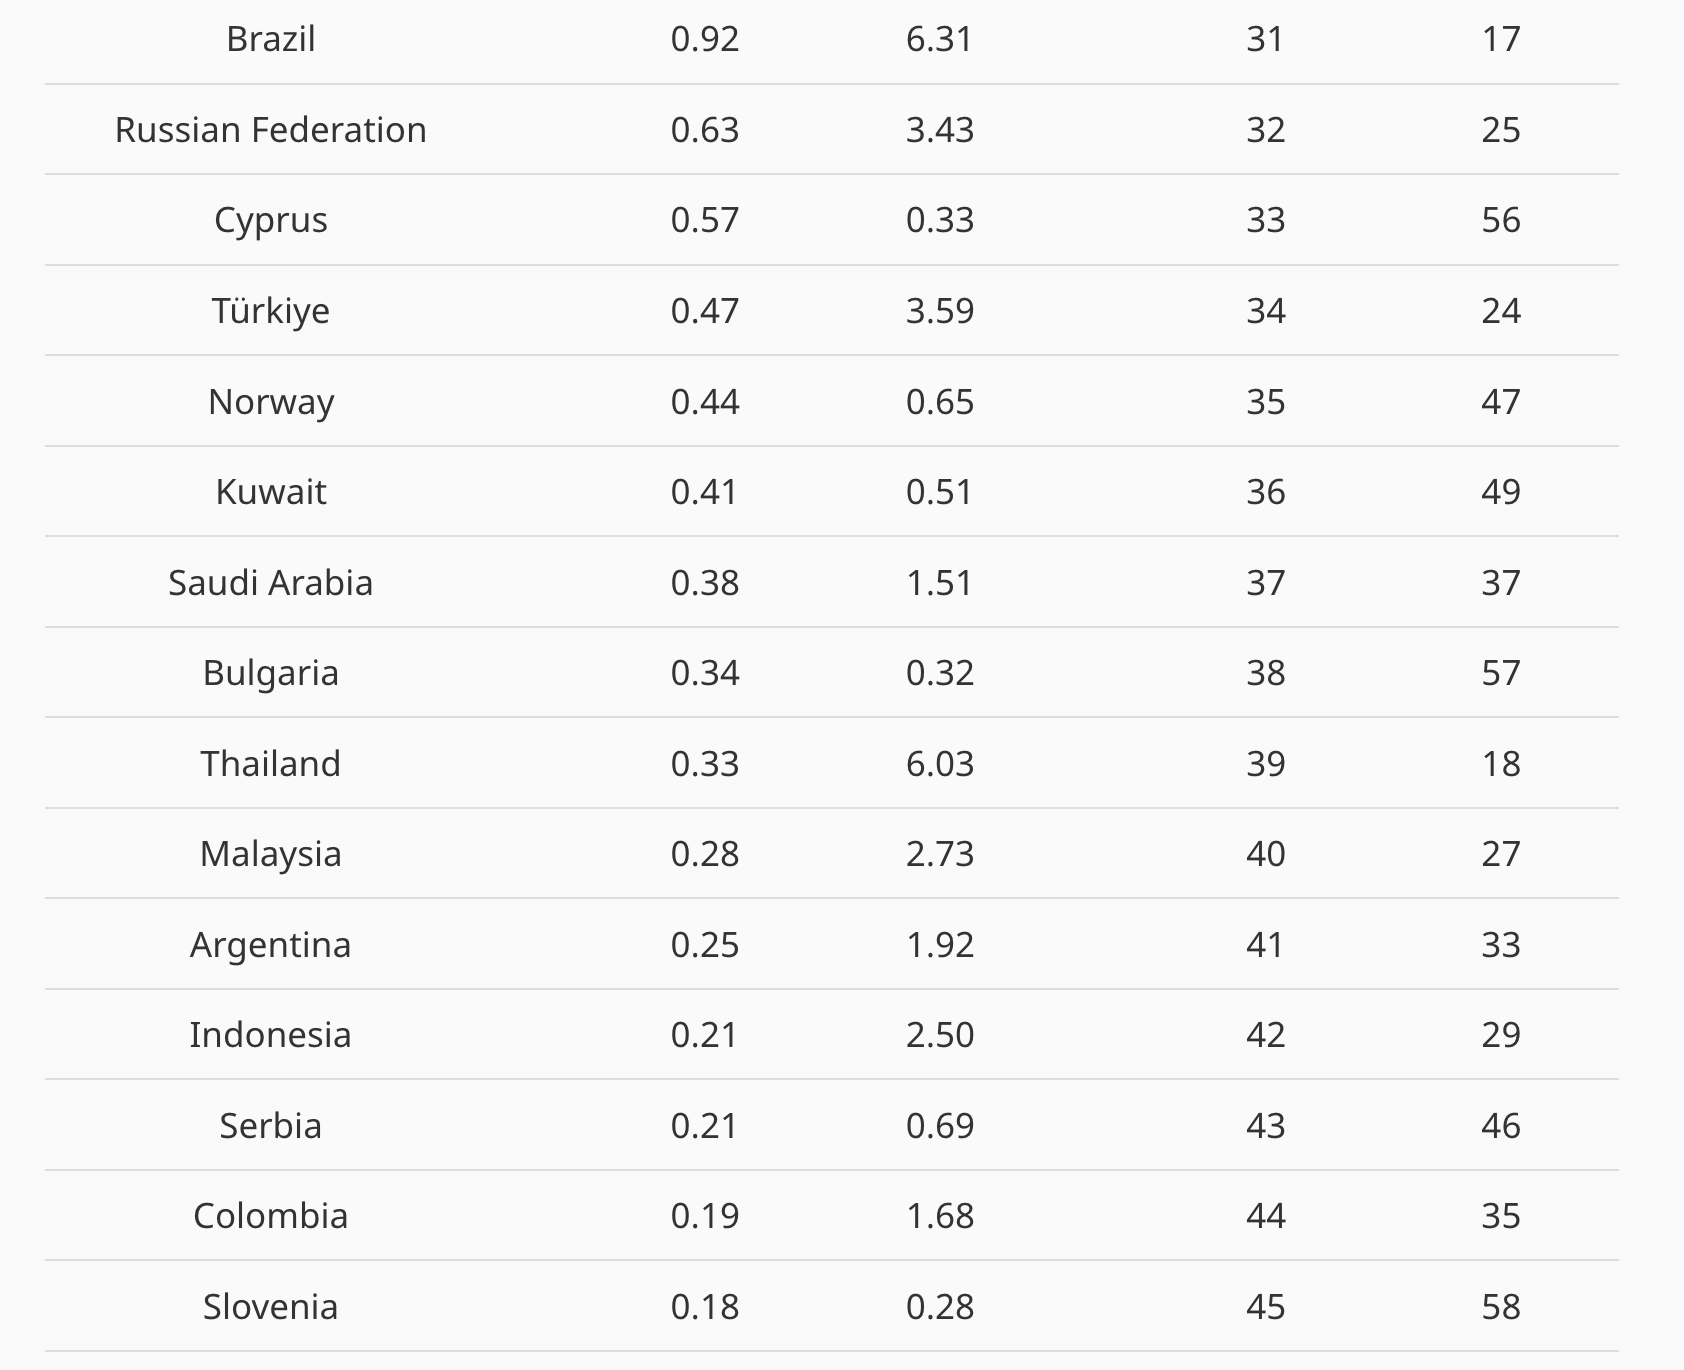
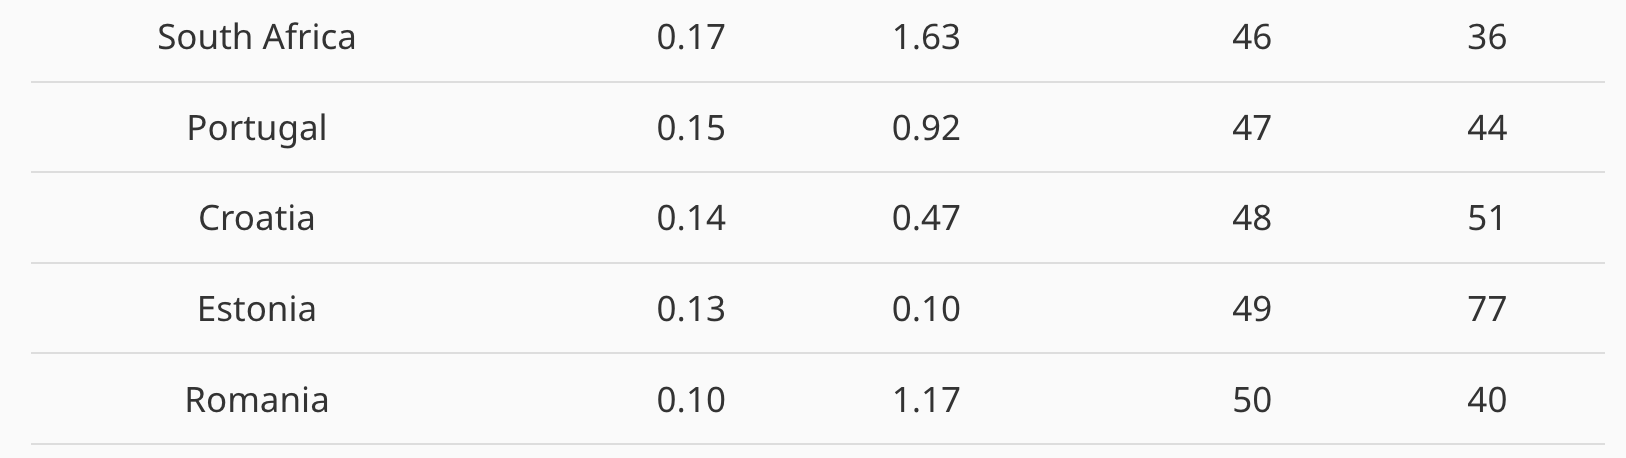
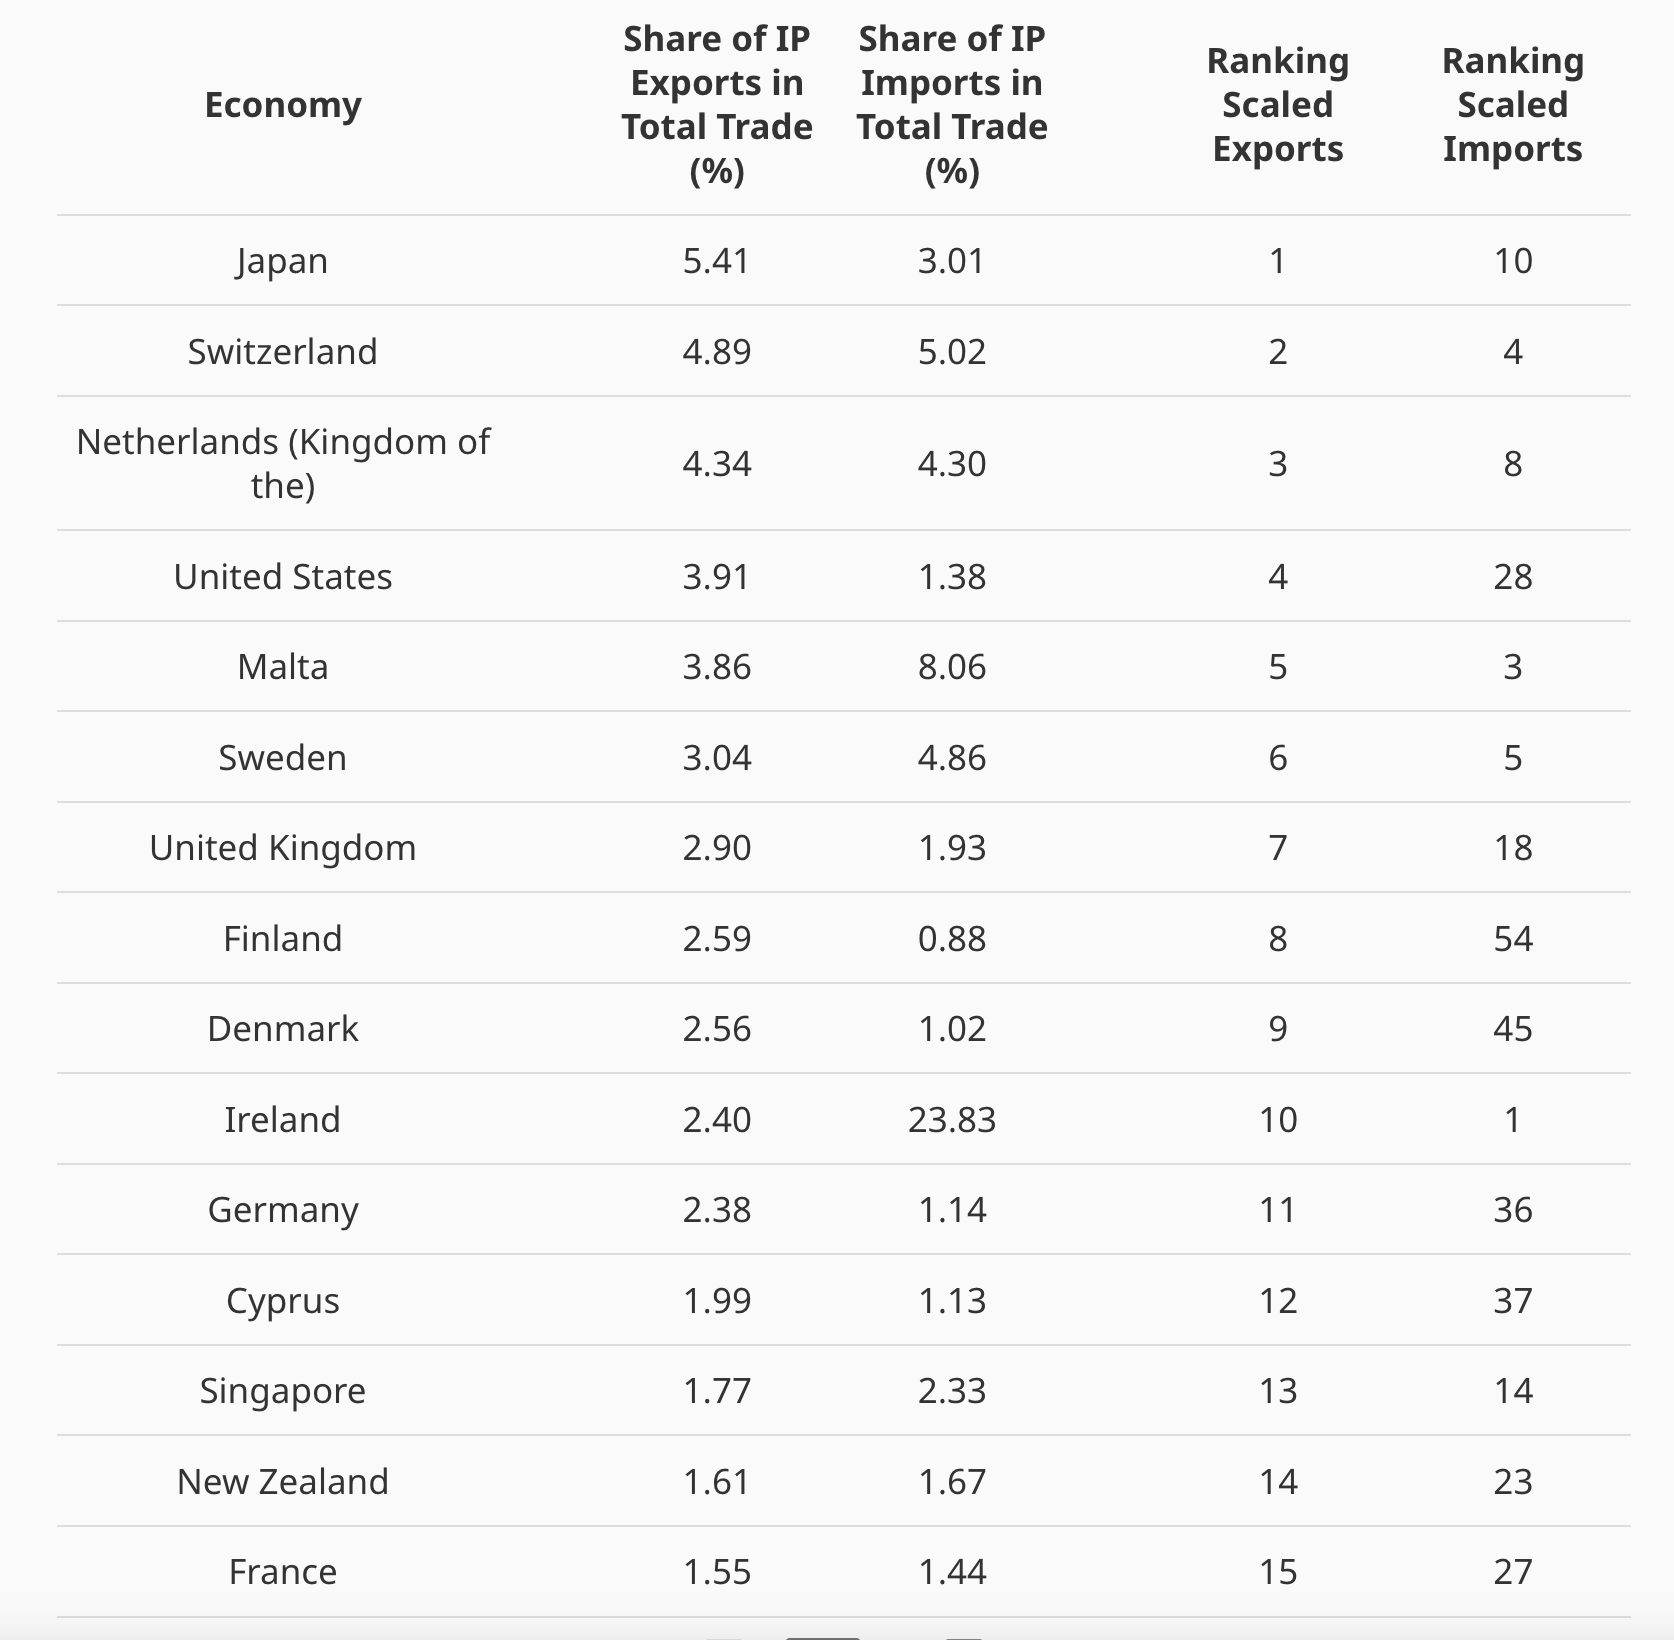
When examining IP trade as a share of total trade, Europe demonstrates particularly strong performance in IP receipts, with European economies featuring prominently in the upper rankings. Switzerland ranks 2nd, the Netherlands 3rd, Malta 5th, Sweden 6th, the United Kingdom 7th, Finland 8th, Denmark 9th, Ireland 10th in IP export intensity. Several European economies also rank highly in IP import intensity, with Ireland leading at first place, followed by Malta (3rd), Switzerland (4th), and Sweden (5th).
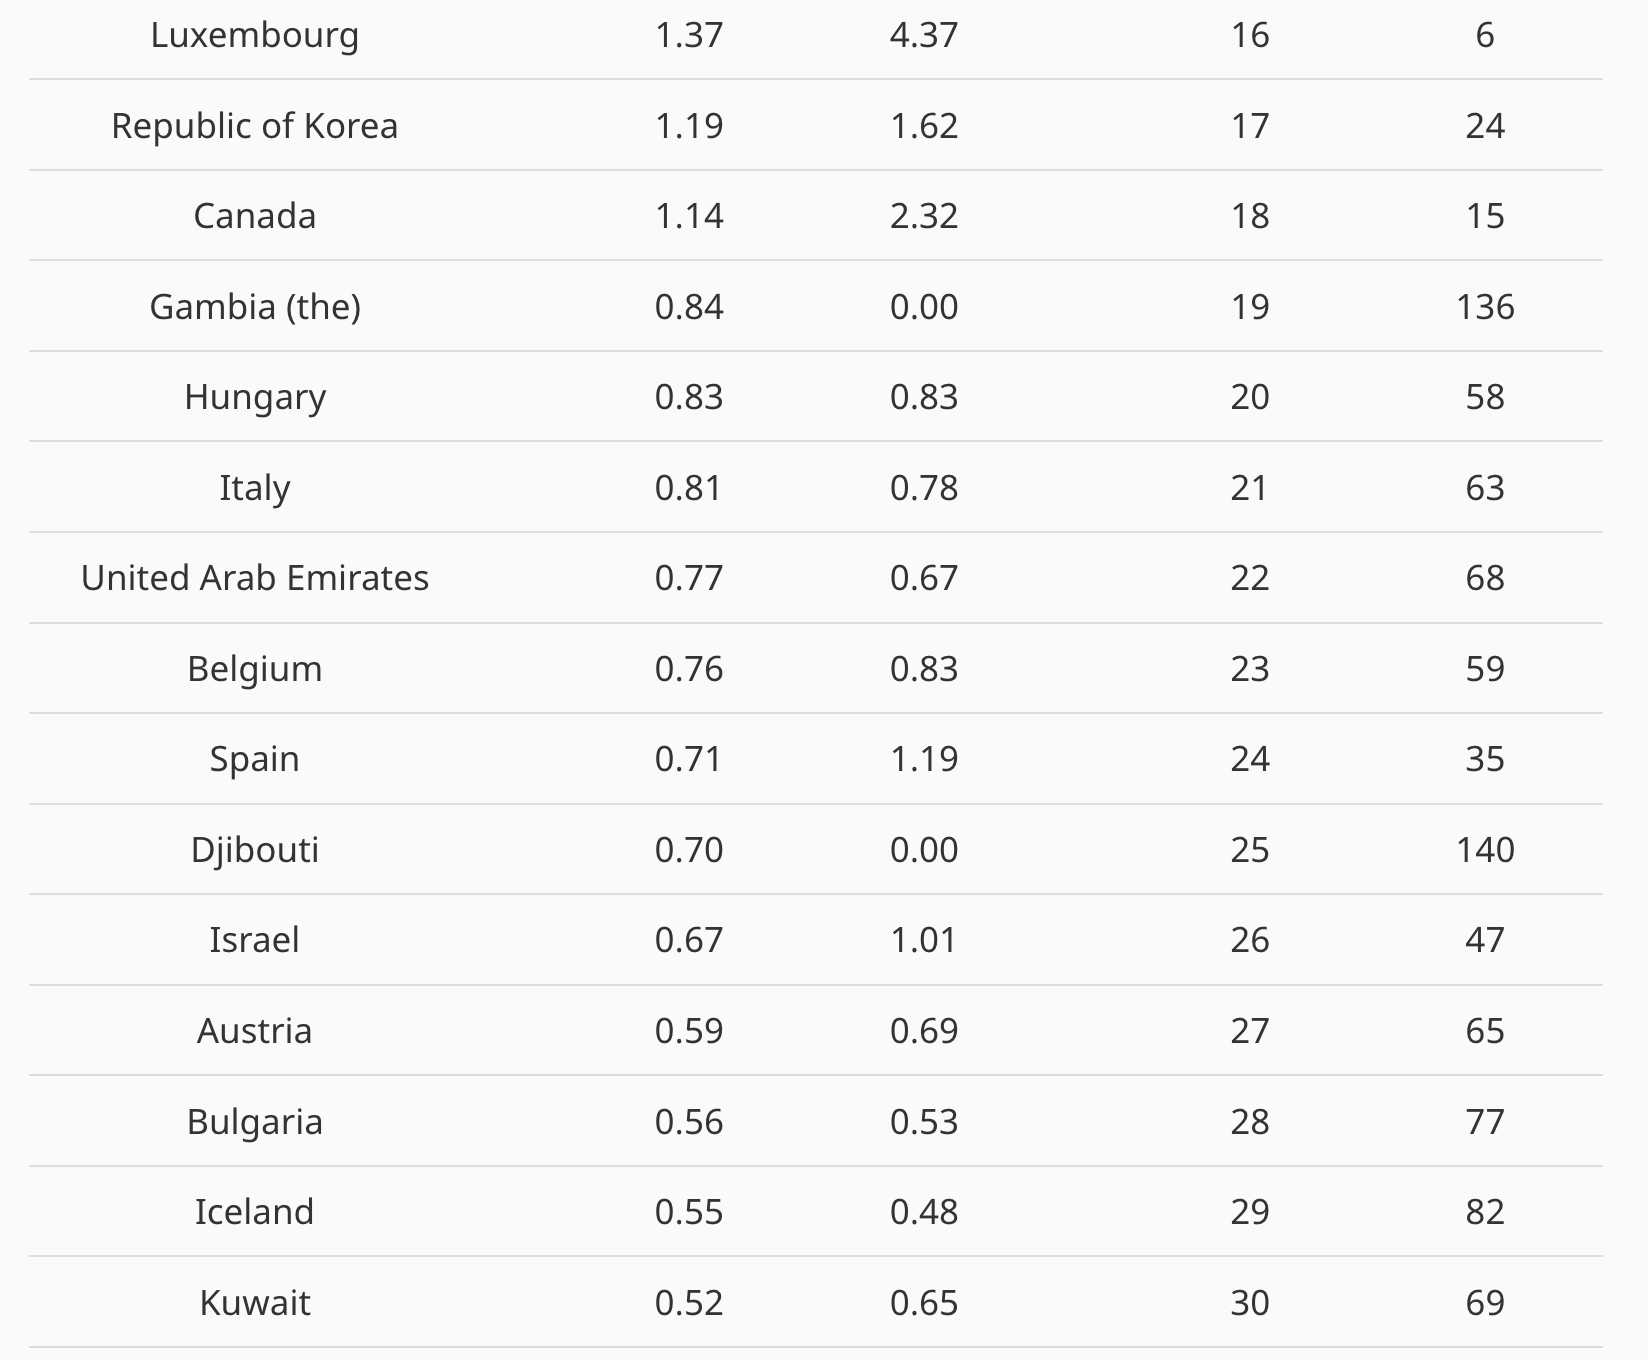
Among emerging economies, Costa Rica ranks highest in IP import intensity, at rank 9th. The other emerging economies in the top 20 are Burundi (10th), Liberia (12th), Colombia (13th), Argentina (16th), Guatemala (17th), the Maldives (19th), and Thailand (20th). On the export side, The Gambia is among the top 20 in IP export intensity, ranking 19th.
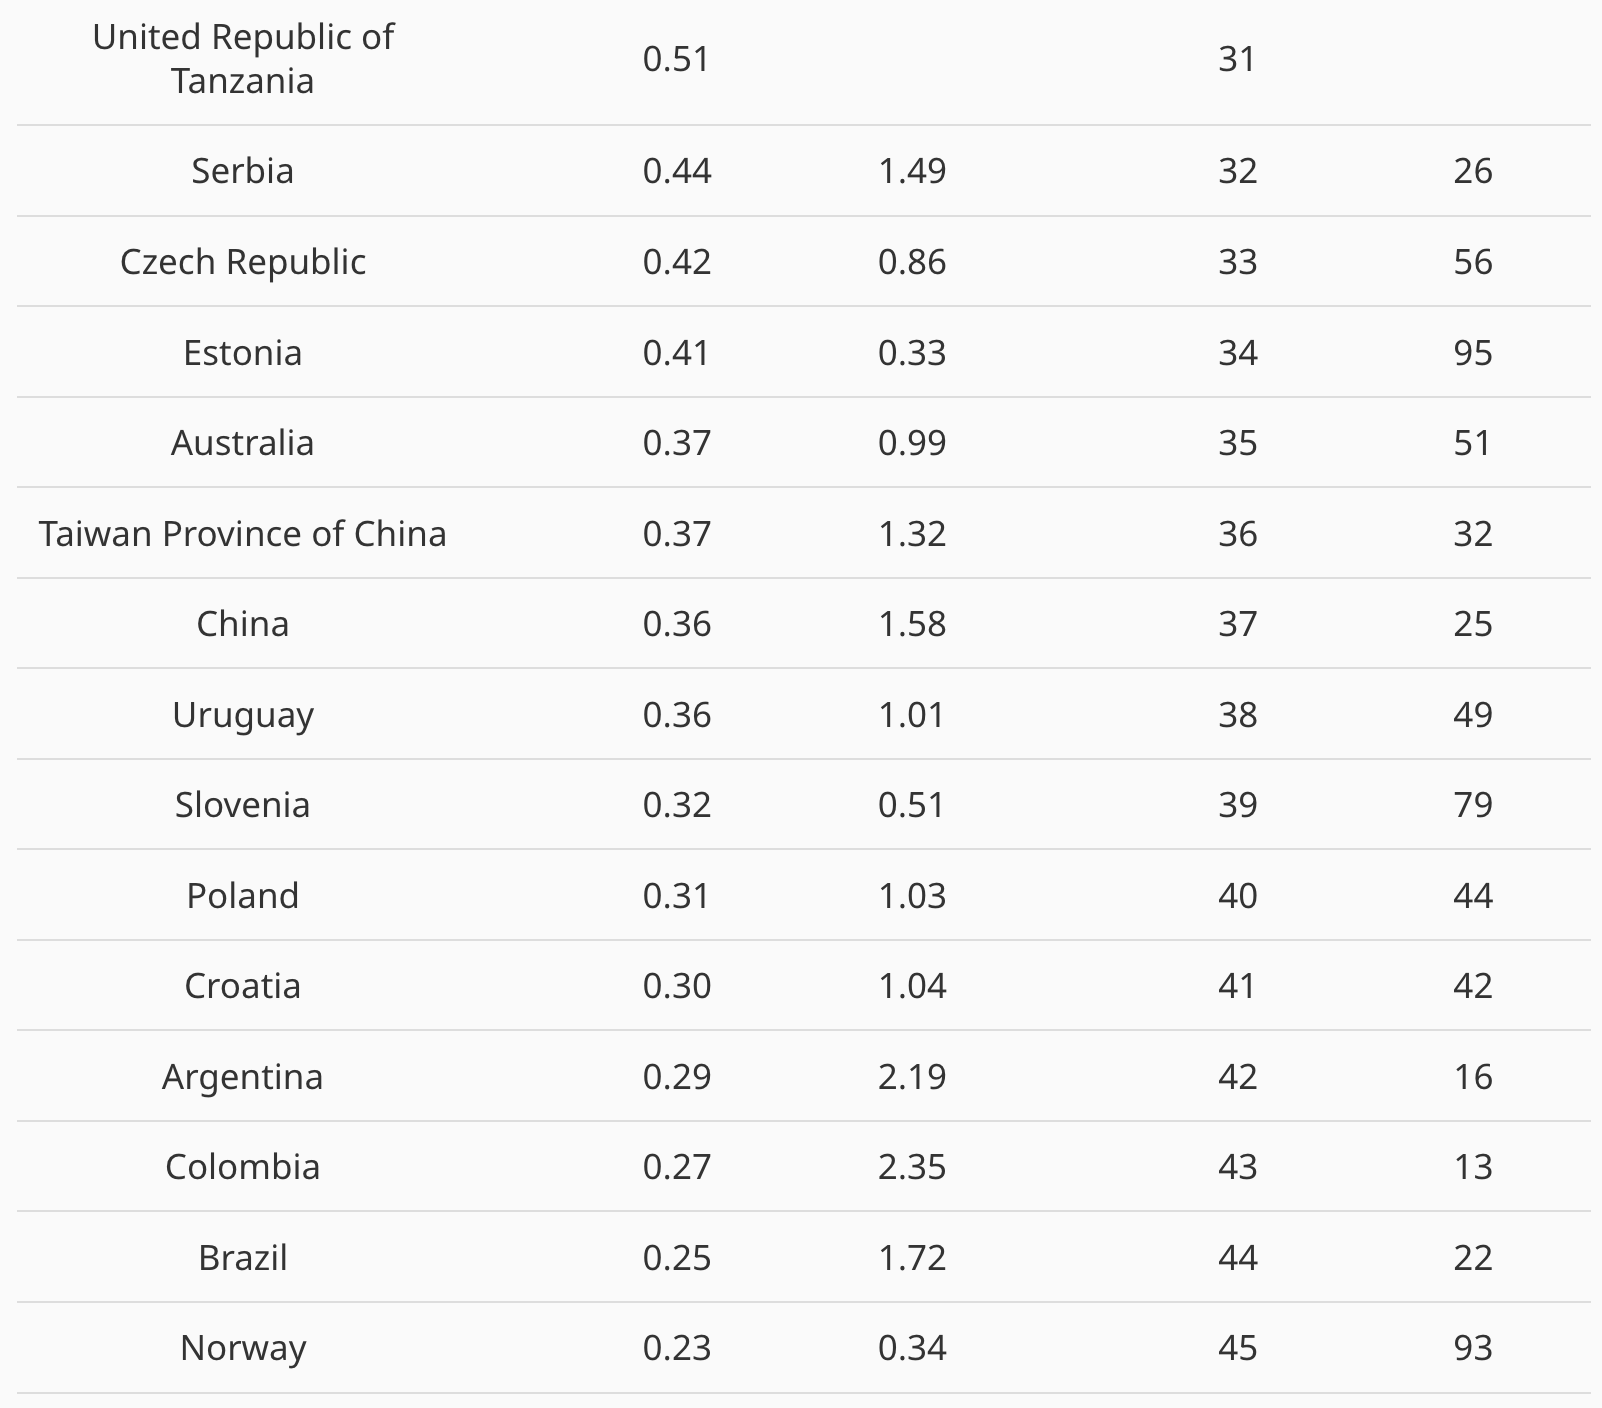
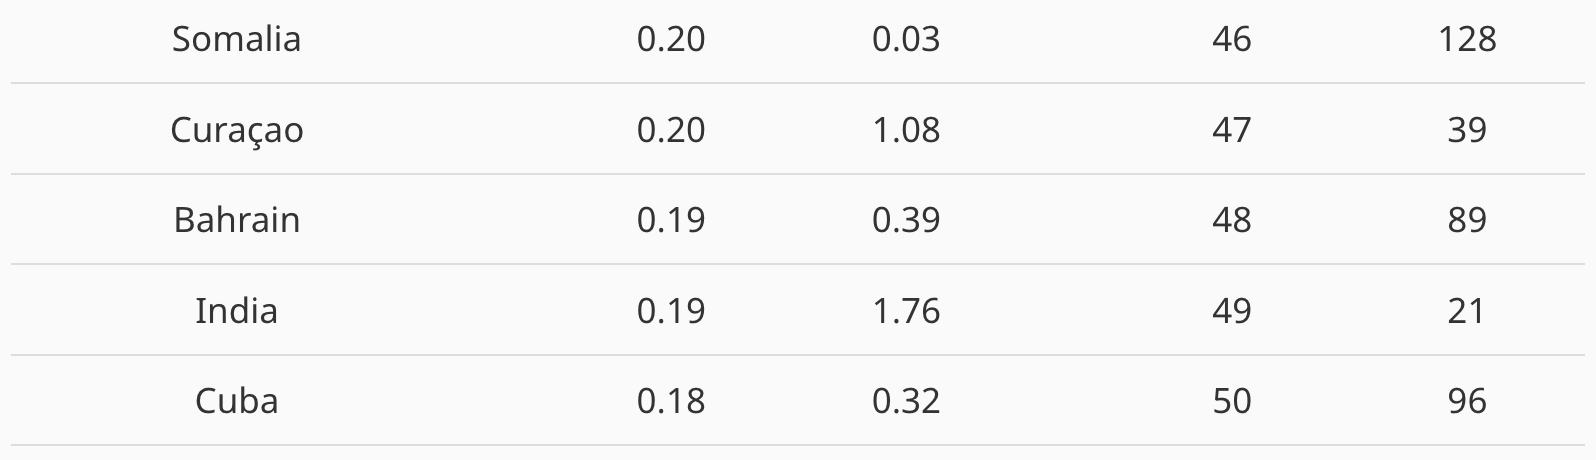
Table 2: IP Trade Intensity - IP Exports and Imports as percentage of Total Trade, 2023
Regional leadership in IP exports
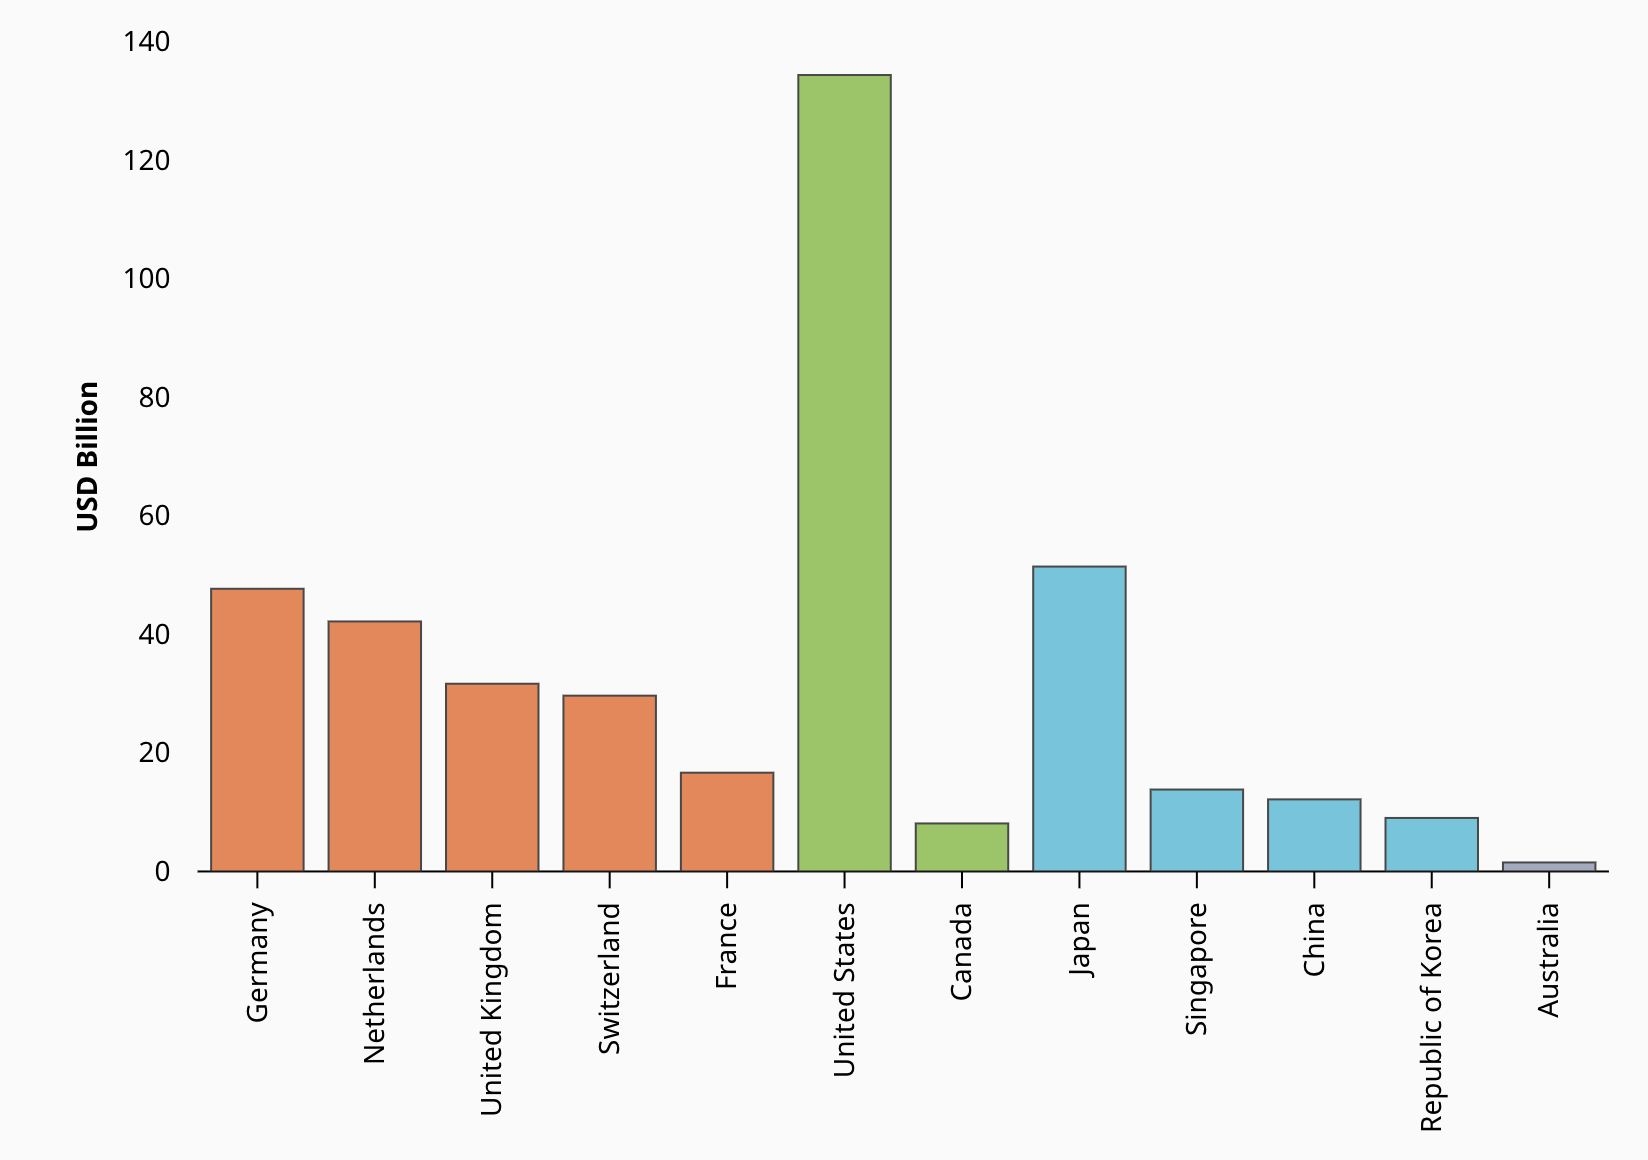
Figure 2a below showcases the leading economies by total IP exports across Europe, Northern America, Southeast Asia, East Asia, and Oceania – the main GII regions. Germany and the Netherlands lead the ranking in Europe, while in East Asia, Japan, China, and Singapore are the top performers in terms of IP exports.
Figure 2a: Global leaders in IP exports by Europe, Northern America, and Southeast Asia, East Asia and Oceania in 2023, in USD Billion
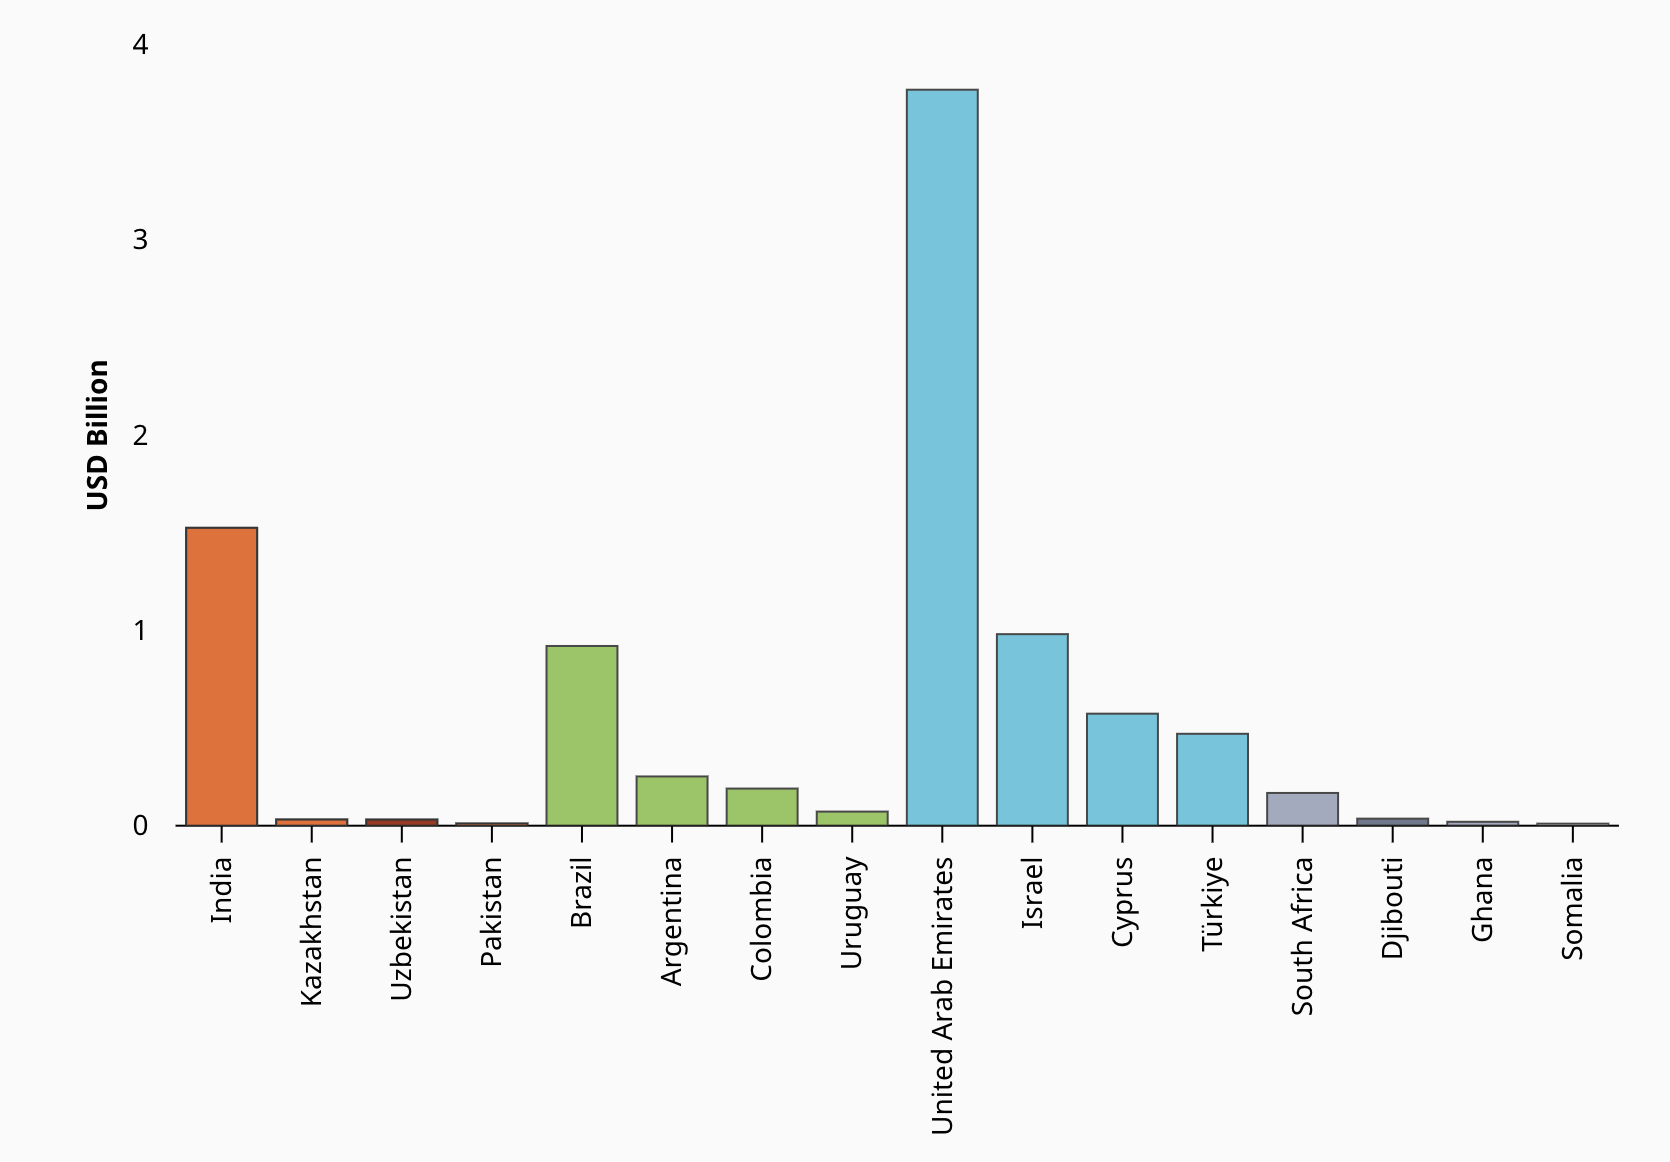
In Central and Southern Asia, the leader is India. In Latin America and the Caribbean, Brazil, Argentina and Colombia are among the top IP exporters. In Northern Africa and Western Asia, the leading economies for IP exports include the United Arab Emirates, Israel, and Cyprus. Finally, in Sub-Saharan Africa, the leading country for IP exports are South Africa, Djibouti and Ghana.
Figure 2b: Global leaders in IP exports by Central and Southern Asia, Latin America and the Caribbean, Northern Africa and Western Asia, and Sub-Saharan Africa in 2023, in USD Billion
This blog concludes with a note of caution on this underlying data.[4] Balance of payments data on IP charges, faces several reliability challenges: transfer pricing problems as firms transfer IP between subsidiaries; Valuation difficulties: Unlike goods, services like IP have no standard market price; Complex IP ownership and contracting structures: IP payments often involve upfront lump sums, milestone payments, and ongoing royalties; Incomplete reporting, particularly for emerging economies, leading to underreporting; and Bundling with other services making it difficult to isolate the true IP component of a transaction. So, the data must be treated with a grain of salt.
Background
More country details can be gleaned from the GII Innovation Ecosystems & Data Explorer 2024.
The Global Innovation Index includes a pillar on Knowledge and Technology Outputs, with threes sub-pillars on knowledge creation (6.1), knowledge impact (6.2) and knowledge diffusion (6.3). The sub-pillar 6.3 includes one indicator Intellectual Property Receipts, % Total Trade (6.3.1) that measures the charges for the use of intellectual property (i.e. receipts) as percentage of the total trade and computed as an average of the three most recent years.
Receipts are between residents and non-residents for the use of proprietary rights (such as patents, trademarks, copyrights, industrial designs, including trade secrets and franchise) and for licenses to reproduce or distribute (or both) intellectual property embodied in produced originals or prototypes (such as copyrights on books and manuscripts, computer software, cinematographic works and sound recordings) and related rights (such as for live performances and television, cable or satellite broadcast). Total trade is defined as the sum of total imports of code G goods and code SOX commercial services (excluding government goods and services not included elsewhere) plus total exports of code G goods and code SOX commercial services (excluding government goods and services not included elsewhere), divided by 2.
Data for the GII draws on the World Trade Organization (WTO) Statistics - Global Services Trade Data Hub. Trade in Services by Mode of Supply (TISMOS) dataset.
Footnotes
[1] See Chapter 1, The changing face of innovation and intellectual property, in WIPO (2011), World IP Report, Geneva. WIPO and Taubman, Antony, and Jayashree Watal, editors. Trade in Knowledge: Intellectual Property, Trade and Development in a Transformed Global Economy. Cambridge University Press, 2022.
[2] See IMF (2014), BPM6 Compilation Guide: Companion Document to the Sixth Edition of the Balance of Payments and International Investment Position Manual. Washington, D.C.: International Monetary Fund
and IMF (2023), Treatment of Intellectual Property Products in Balance of Payments: Discussion Note. BOPCOM—23/03. Forty-Second Meeting of the IMF Committee on Balance of Payments Statistics, Bali, Indonesia, October 24–26, 2023. Washington, D.C.: International Monetary Fund.
[3] For statistical frameworks on the recording of cross-border flows of intellectual property products and intangible assets, see IMF (2014), BPM6 Compilation Guide: Companion Document to the Sixth Edition of the Balance of Payments and International Investment Position Manual. Washington, D.C.: International Monetary Fund
and IMF (2023), Treatment of Intellectual Property Products in Balance of Payments: Discussion Note. BOPCOM—23/03. Forty-Second Meeting of the IMF Committee on Balance of Payments Statistics, Bali, Indonesia, October 24–26, 2023. Washington, D.C.: International Monetary Fund.
[4] As noted in earlier WIPO studies, but also a WTO publication on the Trade of Ideas, capturing international payments related to the trade of ideas – relative to standard services and certainly goods - is challenging. See Neubig, T., & Wunsch-Vincent, S. (2022). A Missing Link in the Analysis of Global Value Chains: Cross-Border Flows of Intangible Assets, Taxation and Related Measurement Implications. In A. Taubman & J. Watal (Eds.), Trade in Knowledge: Intellectual Property, Trade and Development in a Transformed Global Economy (WTO Internal Only, pp. 194-217). Cambridge: Cambridge University Press.