Cross-border e-commerce initially contracted in Uruguay because of the pandemic but started to show a pronounced recovery in mid-2020. Data on all credit and debit card purchases made abroad in the framework of the country’s franchise regime revealed that it decreased significantly between January and May 2020.[1] The aggregate annualized value of these purchases from Uruguay dropped 5.9% over this period. However, in June 2020, online purchases abroad grew around 37% relative to June 2019.
What happened with cross-border e-commerce in Uruguay in the most recent 15 months? Using the same, updated detailed data, we found that (i) the recovery has continued, driven by an increase in the number of transactions made by a larger number of buyers; (ii) there has been a shift in the geographical origins towards the United States and away from China; and (iii) there has been a stronger trend to substitute electronics for apparel.
Cross-Border e-commerce grew significantly in terms of values, shipments, and buyers
Uruguay’s cross-border e-commerce has expanded substantially since mid-2020. Annual online purchases abroad grew about 42% between May 2020 and September 2021 to reach US$ 82 million. In terms of weight, the growth was around 40% over the same period and the total topped almost 1.5 million kilos. These annual values were already 33% larger than those registered in February 2020, the month before the onset of the pandemic (Figure 1—left panel), and more than 200% larger than those prevailing at the end of 2014, the first full year of the regime. As a reference, standard annual imports increased 17.6% from May 2020 to September 2021.
This expansion can be primarily traced back to an increase in the annual number of transactions, whichexceeded 600,000 in all months from May to September 2021. This growth, in turn, was mainly driven by significant enlargement of the buyer base, which grew 16% since May 2020. Consequently, in September 2021, the number of buyers in Uruguay that bought online abroad in the previous 12 months was almost 350,000, which amounted to more than 12% of the country’s adult population. On average, these buyers made more purchases over one year. Although to a lesser extent, the increased average transaction size also contributed to the growth of cross-border e-commerce. The annual average shipment value rose roughly 14% between May 2020 and September 2021.[2]
Figure 1
Uruguay, January 2018-September 2021

Changes in source countries and sourced products
The increase in the average purchase value per buyer was associated with a shift in e-commerce geographical patterns. The percentage share of the United States as a source country increased 2.3 percentage points in terms of value and 11 percentage points in terms of the number of transactions since May 2020 to account for 97.5% and 95% of the respective totals in September 2021. In contrast, the percentage shares of China decreased by 1.5 and 7.7 percentage points over the same period, respectively. As a result, this country was responsible for only 0.1% and 0.5% of the annual total value and number of transactions in September 2021, down from 2.4% and 12.0% in 2019 (Figure 2).
Figure 2
Uruguay, Annual Online Purchases, by Main Country of Origin, January 2018-September 2021
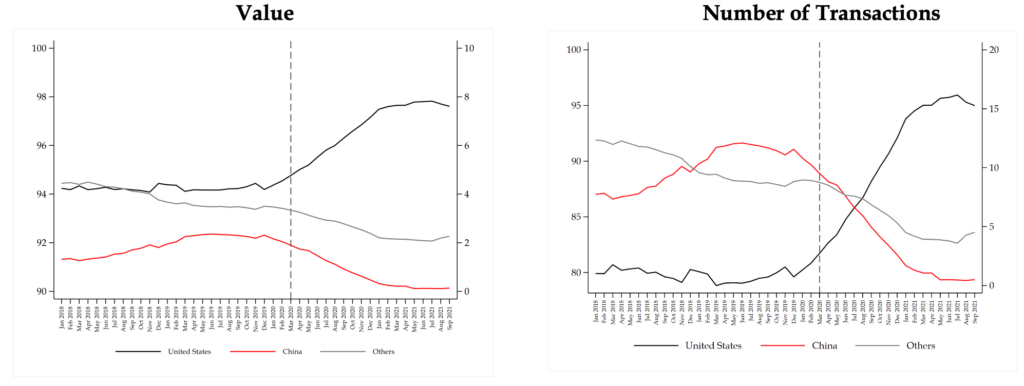
The figure shows the percentage share of annual total online cross-border purchase values (left panel) and the number of transactions (right panel) accounted for by the United States (primary y-axis) and China and other origins (secondary y-axis).
Consistently, already ongoing changes in sectoral patterns became more pronounced. Machines, appliances, electrical material, and their parts became relatively more important. In contrast, the opposite holds for textiles and wearing apparel, thus reinforcing the trend observed before the beginning of the pandemic. The percentage share of the former set of products reached 17.0% in terms of value and 16.6% in terms of the number of transactions in September 2021, from 15.3% and 13.8% in May 2020, respectively.[3] Conversely, textiles and wearing apparel contracted relatively, with their share falling 2.3 percentage points in terms of value and 3.1 percentage points in terms of the number of transactions, after being 22.8% and 22.9% in May 2020, respectively (Figure 3).[4]
Figure 3
Uruguay, Annual Online Purchases, by Main Product Category, January 2018-September 2021
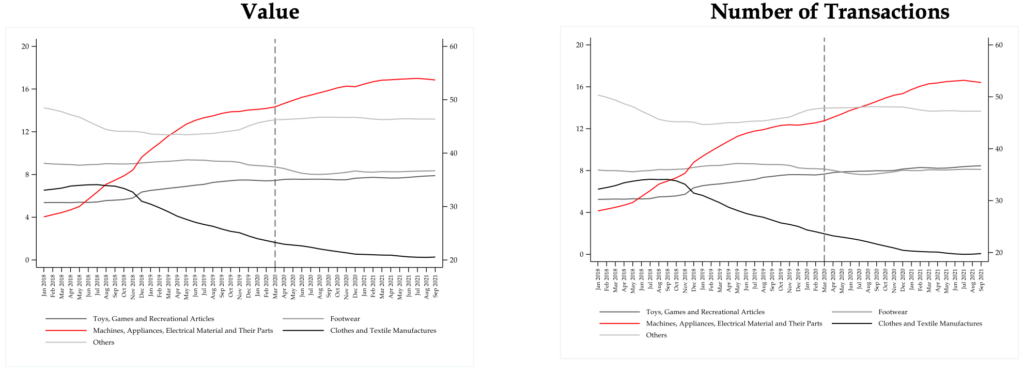
The figure shows the percentage share of annual total online cross-border purchase values (left panel) and the number of transactions (right panel) accounted for by electronics, toys, and footwear (primary y-axis) and textiles and other products (secondary y-axis).
Looking ahead
Cross-border e-commerce recovered from the sharp decline experienced in the first semester of 2020. As explained, the trend to substitute electronics for apparel is likely to reflect both supply and demand factors. These are related to production and distribution constraints and to consumer behavior changes consisting of switching from more apparel-intensive business office activities to more electronics-intensive in-home activities derived from lockdowns, respectively.
This recovery was substantially faster than that of total standard imports. Thus, while both annualized total cross-border e-commerce and import values behaved similarly in the months before the pandemic, the former exceeded the respective pre-pandemic levels already in August 2020, compared to May 2021 for the latter. Interestingly, the share between the two indices, which initially increased, started to consistently decrease since May 2021 as online purchases abroad showed signs of deacceleration, and standard imports continued to expand vigorously (Figure 4). These developments naturally lead to the question of whether cross-border e-commerce can react in a more agile manner than regular trade to shocks and can be a leading indicator for the latter.
Figure 4
Uruguay, Standard Imports and Annual Online Purchases, October 2019-September 2021
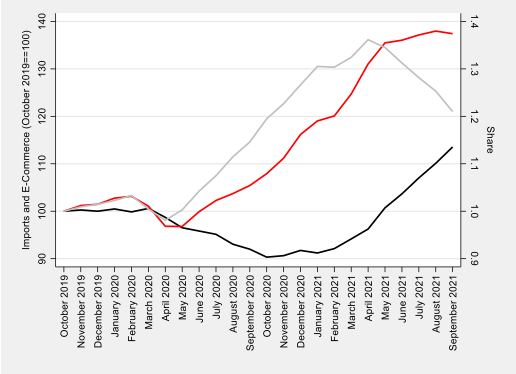
The figure shows the evolution of annualized standard imports (black) and annualized online cross-border purchase values (red) using indices that take the value of 100 in October 2019 for both series (primary y-axis) and the share between the two indices (gray) (secondary y-axis).
In this sense, and in addition to improving contextual conditions and addressing explicit barriers to digital trade, countries in Latin America and the Caribbean (LAC) should develop and implement accurate and internationally consistent measurement strategies. They should also ensure the safe and expeditious processing of shipments through standardization of procedures, the electronic interconnection between customs and postal and logistic operators to enable advanced cargo information, and the integration of new technologies such as artificial intelligence and machine learning to allow for automation of risk management. The Inter-American Development Bank, through its Integration and Trade Sector, is providing support to LAC countries in these areas through loans, technical cooperation, and dedicated policy research projects.
[1] First established in 2012, this regime allows all adult Uruguayans (older than 18 years) to buy non-commercial merchandise abroad up to three times in a year for up US$ 200 (and 20 kilograms) each, without paying customs duties or taxes.
[2] Given the existence of restrictions in the use of the system at the individual level, it could be expected that expansions of total cross-border e-commerce values take place primarily along the buyer extensive margin—i.e., the number of buyers. Note, however, that average annual values were below the respective thresholds, which would indicate that those restrictions were not generally binding. Still, the percentage share of individuals whose online purchases abroad reached (or exceeded) US$ 200 or 20kg within a given month increased from less than 20% in January 2018 to around 30% in September 2021.
[3] The shares were, on average, 12.7% and 11.3% during 2019, respectively.
[4] These shares were, on average, 27.3% and 27.9% over 2019.